Using (roughly) the Burns-Mitchell-NBER approach. Incomplete listing, focused on those updated over time, by agencies, firms, or other organizations. (update of post 12.6.2021)
For single economies:
- United States (NBER)
- Euro area (CEPR/EABCN) [latest]
- France (Fr.Econ.Assn.) [in English]
- Japan (Cabinet Office) [chronology] (note: this is a government agency source)
- United Kingdom (NIESR) [chronology up to 2010 in Table 4]

- United Kingdom (ONS) [chronology based on GDP] [note: this is a government agency source]

- Spain (Spanish Economic Association) (h/t Malte)
- Germany (German Council of Economic Experts) [chronology] (note: this is a government agency source)

- C.D. Howe Institute [chronology to 2012]

Cross country:
- Economic Cycle Research Institute [chronology (PDF)]
- OECD (includes non-OECD economies, aggregates)
- Conference Board (US)
The methodologies differ, with varying degrees of judgmental input and input series; some observations in this post. In Chinn and Kucko (2015) and Chinn and Ferrara (2024), we relied upon the ECRI chronologies. There are numerous other approaches, including for the US Jim Hamilton’s time series approach applied to GDP [latest announcement].
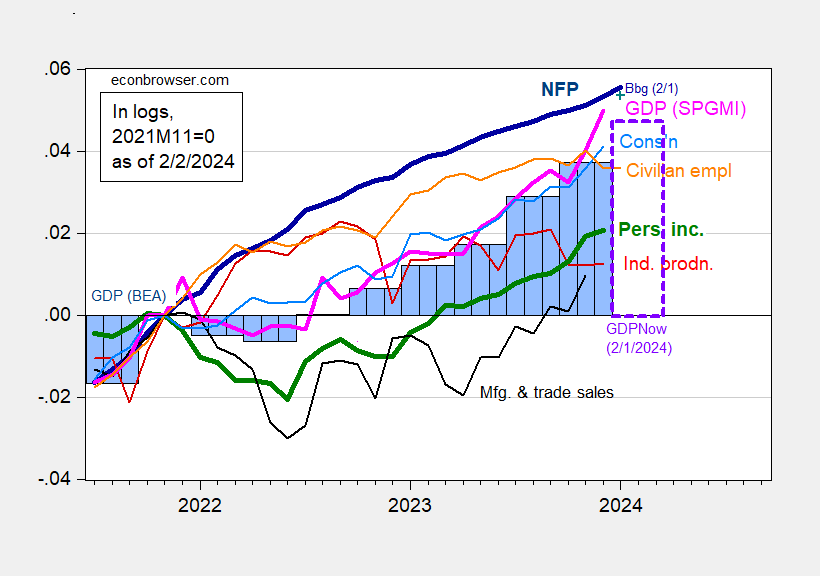
As an aside, here are six key macro indicators (at monthly frequency, as of 2/2/2024) followed by the NBER BCDC:
Figure 1: Nonfarm Payroll employment incorporating benchmark revision (bold dark blue), implied level using Bloomberg consensus as of 2/1 and December 2023 NFP (blue +), civilian employment (orange), industrial production (red), personal income excluding current transfers in Ch.2017$ (bold green), manufacturing and trade sales in Ch.2017$ (black), consumption in Ch.2017$ (light blue), and monthly GDP in Ch.2017$ (pink), GDP, 3rd release (blue bars), GDPNow for 2024Q1 as of 2/1 (lilac box), all log normalized to 2021M11=0. Source: BLS via FRED, BLS preliminary benchmark, Federal Reserve, BEA 2023Q3 2nd release incorporating comprehensive revisions, S&P Global Market Insights (nee Macroeconomic Advisers, IHS Markit) (2/1/2024 release), and author’s calculations.
Any leads to other agency/organization chronologies welcome.
Other individual studies discussed on Econbrowser:
- Ferrara on Germany.
- Hamilton discusses Stock/Watson.
- Frankel on when negative growth is too rare (or common)

Pay attention undergrads!!!! [ or my truly favorite alternative peer group, kinda-loser-ish middle aged guys ]