Forty years ago, I was working for Bob Crandall as an RA at Brookings, on how much the voluntary export restraints (VERs) added to the costs of a typical Japanese imported car. He found that number to be about $820 (a Datsun Stanza was about $6700 in 1981), and a comparable domestically produced car by about $370 (since the VER puts up a wall that allows domestic producers to raise prices). Today, according to Wells Fargo, the 25% tariffs would result in a vehicle assembled in Mexico or Canada to go up in price by $8000-$10000, while the average over all cars using imported parts will go up about $2100 (average car price in March 2024 is about $47000; a Ford F150 STX is about $42000).
Category Archives: autos
Looking Backward to the “Recession of 2022H1” and Forward to the Recession of 2023
Ever wonder whether vehicle miles traveled (VMT) does a good job of predicting recessions? You should’ve stopped after looking at this Econbrowser post from January 4th, but I thought an update to most recent data would be of interest as we obtain December data. First take a look at what VMT does over recessions, versus heavy truck sales (suggested by Calculated Risk at some points), and the eponymous Sahm Rule (real time version).
Does a Decline in the 12 Month Moving Average of VMT Presage a Recession?
Mr. Steven Kopits writes:
But by and large, VMT on a 12 mms basis turns a bit before or right at the start of a recession.
So You Think We Might Be In a Recession Today (Part II)?
Look around at enough indicators (say vehicle miles traveled) and you might think so. A follow up to this post. Let’s look at what conventional and high frequency indicators say.
Update on sanctions, oil prices, and recession
I gave an updated talk on this topic for the Better Policy Project yesterday. Slides available at
this link, video link below.
Why did U.S. real GDP fall?
The Bureau of Economic Analysis announced today that seasonally adjusted U.S. real GDP fell at a 1.4% annual rate in the first quarter. What does this portend?
Continue reading
Oil sanctions and recession
After a wild ride up to $130 a barrel, the price of oil has come back down to its level from before Russia invaded Ukraine. Russian oil may be finding buyers despite the sanctions, and U.S. production continues to recover. But the situation remains very uncertain, and a big disruption in the quantity of Russian oil that reaches world refineries is a very significant possibility. In my previous post, I examined the causes of the run-up in the price of oil that had already occurred before the invasion and discussed the implications for U.S. inflation. Today I comment on the possible implications of further supply disruptions for U.S. real GDP.
Continue reading
The COVID recession is over
The Bureau of Economic Analysis announced today that seasonally adjusted U.S. real GDP grew at a 4.0% annual rate in the fourth quarter. That’s well above the 3.1% average growth that the U.S. experienced over 1947-2019, and follows a 28.8% logarithmic annual growth rate seen in Q3.
Continue reading
The Trade Balance Today, and Near Future
If we wanted to reduce the trade deficit — let’s say because we wanted to increase aggregate demand and hence employment, rather than some atavistic belief the deficits are bad — then we will probably need to convincingly deal with the pandemic. Remember, the trade deficit (in NIPA terms) is now bigger than it was the day Mr. Trump took office.
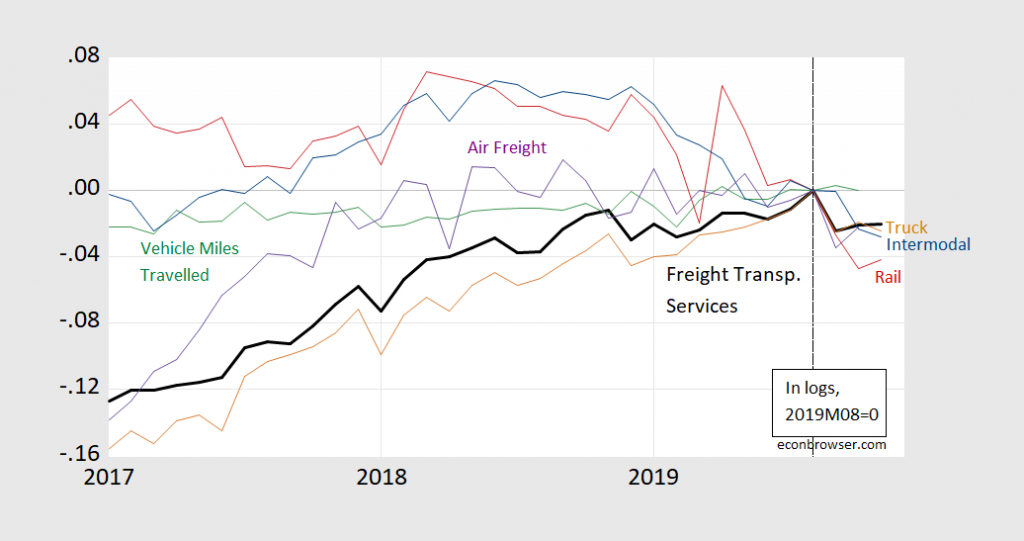
Planes, Trains, and Automobiles – and Trucks
Figure 1: Freight Transportation Services Index (bold black), Truck Tonnage Index (tan), Vehicle Miles Traveled (green), Rail Freight Carloads (red), Rail Freight Intermodal Traffic (blue), Air Revenue Ton Miles of Freight and Miles (purple), all in logs, 2019M08=0. Source: BTS via FRED, and author’s calculations.
All series are below peak.
