The Bureau of Economic Analysis announced today that seasonally adjusted U.S. real GDP grew at a 4.0% annual rate in the fourth quarter. That’s well above the 3.1% average growth that the U.S. experienced over 1947-2019, and follows a 28.8% logarithmic annual growth rate seen in Q3.
Continue reading
Category Archives: economic growth
WSJ October Survey: Q3 Growth Revised Up, Q4 Down
In levels (incorporating revisions to actual GDP):
Deal/No Deal
Macro (GDP) implications of “no deal”.
Implications of a “No Recovery Package” Outcome
From Deutsche Bank on Sunday:
In the US, fiscal uncertainty is a major issue. As outlined above, we now assume that significant further support will not be forthcoming until after the election. The resulting drop in income support for households is already beginning to depress activity and we see GDP growth slowing to near zero in Q4 as consumer spending slides. Growth will pick up in Q1 with some post-election fiscal support.
Explaining the Administration’s Economic Forecast
The Economic Report of the President, 2020 is out as of today. Chapter 9 presents the underpinnings for the seemingly implausible GDP forecast presented in the Budget last week — a forecast that’s a full percentage point faster than CBO’s.
Eight Graphs Depicting the Macro Situation as of end January
For now, we know as of 2019Q4, we’re not in a recession, according to Jim’s analysis. But Q4/Q4 GDP growth fails to hit Trump targets (again!), business cycle indicators continue to plug along, but RV sales plunge 16% y/y. And yield curve inverts (again)! Is it flight to safety or lower expected future short rates?
Why Is the 2019 Slowdown Different than the 2016 Slowdown?
Consider the rest-of-the-world… Who’s going to pick up the slack this time?
Where Did All the Stimulus Go?
By April 2018, the Tax Cut and Jobs Act and the Bipartisan Budget Act of 2018 had been put into law. The CBO projected a bump in GDP growth, relative to counterfactual. (According to the CBO, the TCJA alone should have pushed output 0.6 percentage points above baseline in 2019.) However, the actual record has been fairly plodding, as shown in the below figure.
What Does Judy Shelton Believe GDP Growth and Inflation Are in 2019?
In a 2015 Cato Institute session, Fed Board Nominee Judy Shelton discusses whether to trust or not official GDP and inflation statistics (she says no — see 1:07:07) (h/t Sam Bell).
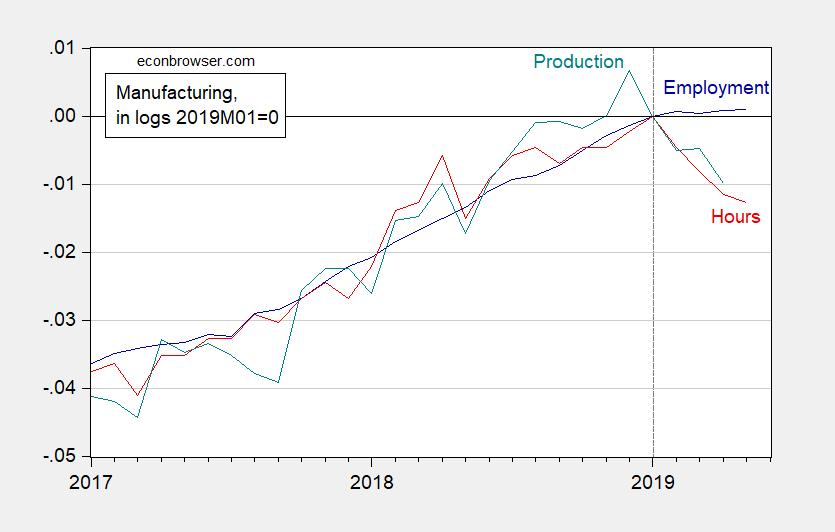
Manufacturing Peak?
With trade volumes flat or trending down worldwide, what to make of US manufacturing?
Figure 1: Manufacturing employment (blue), aggregate hours of production and nonsupervisory workers (red) and production (teal), in logs 2019M01=0. Source: BLS, Federal Reserve via FRED, and author’s calculations.
