Look at this:
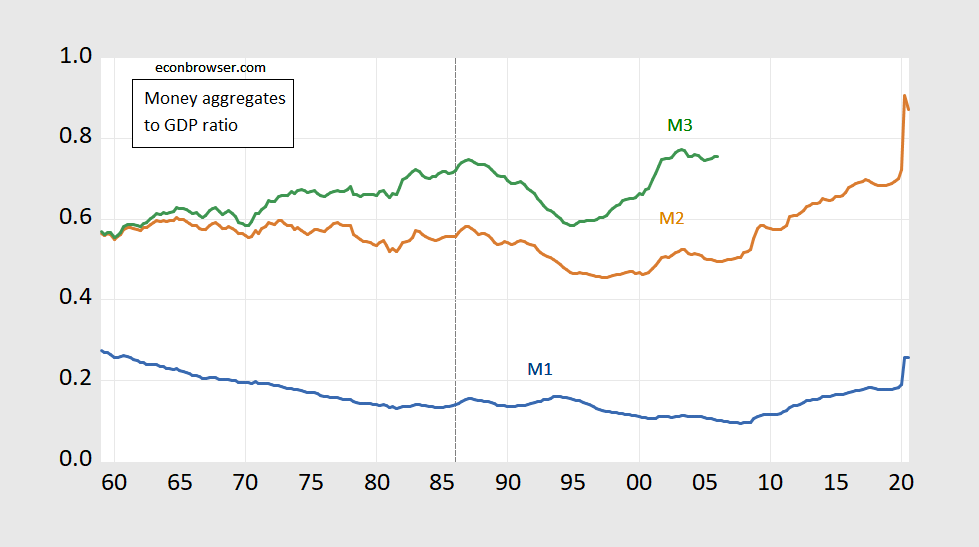
Figure 1: Ratio of M1 to real GDP (blue), of M2 to real GDP (brown), of M3 to real GDP (green), 1959Q1-2020Q3. Quarterly money data average of end of month data. Source: Federal Reserve via FRED, and BEA, 2020Q3 2nd release, and author’s calculations.