Holding to the Old Faith
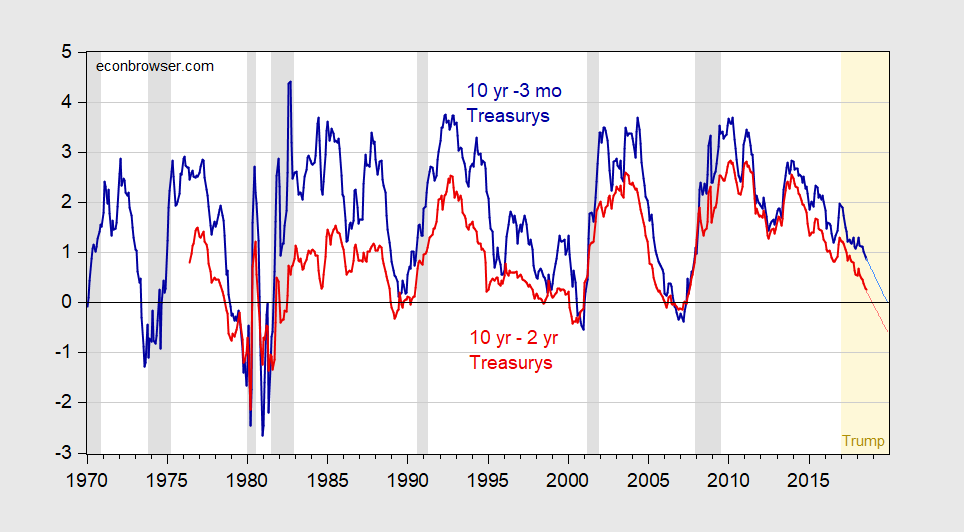
Figure 1: Ten year-3 month Treasury yield spread (bold dark blue), and ten year-two year Treasury yield spread (bold dark red), and projections at current pace using 2017M01-18M08 sample (light blue and pink lines), in percentage points. August 2018 observation through August 27th. NBER defined recession dates shaded gray. Light orange denotes Trump administration. Source: Federal Reserve Board via FRED, Bloomberg, NBER, author’s calculations.
Continue reading