From Reuters today:
Category Archives: inflation
Inflation Breakevens for 5 Year Horizon
As of 7/13:
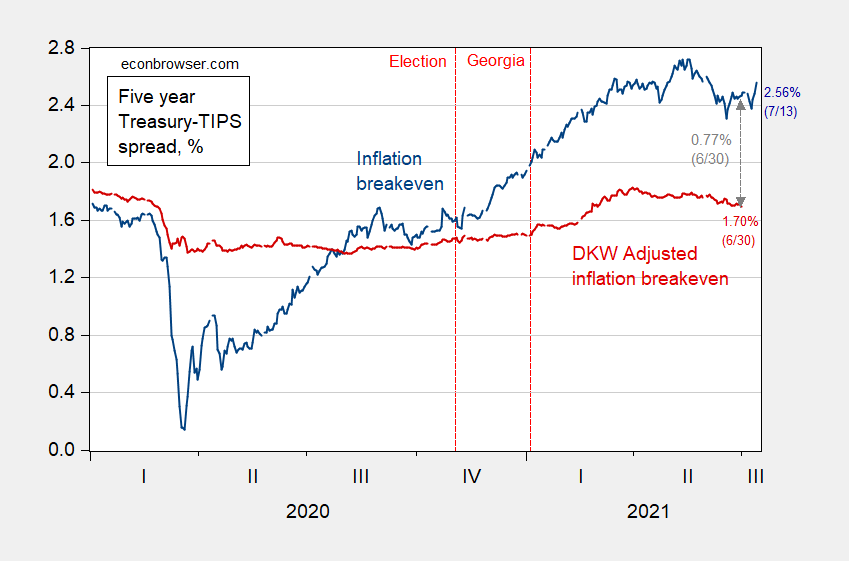
Figure 1: Five year inflation breakeven calculated as five year Treasury yield minus five year TIPS yield (blue, left scale), five year breakeven adjusted by inflation risk premium and liquidity premium per DKW (red, left scale), both in %; and S&P 500 index (black, right log scale). Source: FRB via FRED, Treasury, KWW following D’amico, Kim and Wei (DKW) accessed 6/4, and author’s calculations.
The 5 year breakeven increased by 8 bps going from yesterday to today (I’m taking the “news” as the CPI surprise discussed here); and remains 16 bps below the recent peak on 5/18. That 8 bps increase is pretty substantial since the standard deviation of daily changes is about 4 bps since 2000 (excluding the extreme movements in 2008).
Inflation!
Reuters – “U.S. consumer prices post largest gain in 13 years; inflation has likely peaked”. Surprises on the upside, put in context. Stripping out volatile components, inflation is up; focusing on sticky prices, inflation is down.
The WSJ July Survey of Economists – CPI and GDP Forecasts
The forecasted price level (CPI) has been moved up, as near term expected inflation has increased. Near term GDP growth forecasts upwardly revised, but downside risks remain. Projected output gap small positive at year’s end.
Ordinary People vs. Economists on the CPI Level
Pretty big spread in views, illustrated:
Inflation Expectations – 5 Year Horizon
From Bloomberg today, “The Great Reflation Trade Is Buckling All Across Wall Street”:
Inaugural FT-IGM survey of academic macroeconomists
Judy Shelton on Downward Nominal Wage Rigidity
From the Independent Institute, “The Moment Janet Yellen Moved for ‘Greasing the Wheels’ with Inflation”, discussing a 1996 meeting of the Fed:
Assessing Market Forecasts of Inflation (at 5 Year Horizon)
Joseph E. Gagnon and Madi Sarsenbayev at the Peterson Institute for International Economics have an interesting article on whether economists or markets are better at forecasting. They write:
The Five Year Inflation Breakeven, the S&P500 and the Dollar
The S&P 500 dropped 1.3% on Friday; many accounts attributed the drop to Fed statements indicating an accelerated pace of rate hikes (especially Bullard’s comment), presumably in response to prospects for higher than previously anticipated inflation. Interestingly, market indicators on Friday are not supportive of that interpretation.