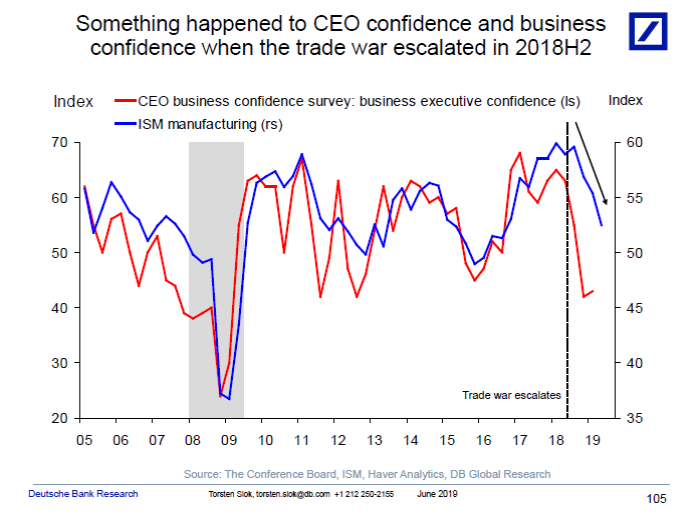
Or, Trumpian Winning, edition 3,010,524. From Torsten Sløk/Deutsche Bank today:
5yr-3mo spread continuously inverted since March 7th; let’s hope Cam Harvey‘s estimated probits are wrong this time around…(although I doubt they are).
Chicago Fed National Activity Index (CFNAI) for April (May comes on June 24th).
With trade volumes flat or trending down worldwide, what to make of US manufacturing?
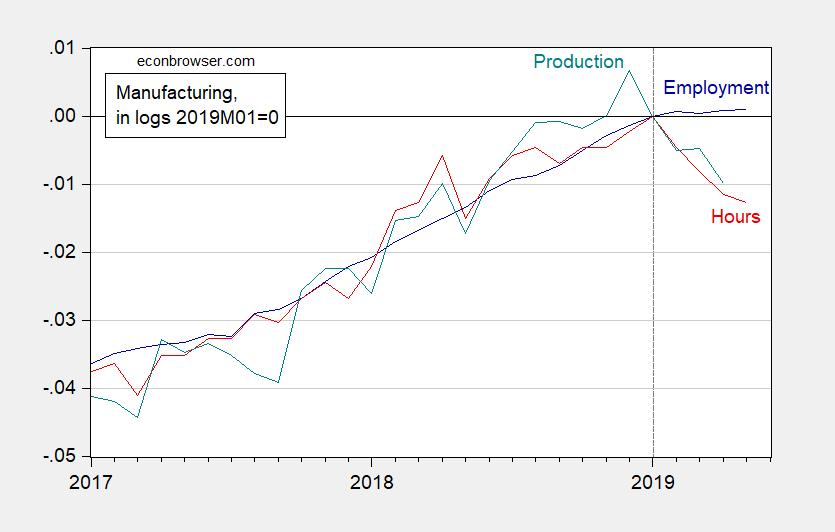
Figure 1: Manufacturing employment (blue), aggregate hours of production and nonsupervisory workers (red) and production (teal), in logs 2019M01=0. Source: BLS, Federal Reserve via FRED, and author’s calculations.
Different forward looking models show increasing likelihood of a recession. Most recent readings of key series highlighted by the NBER’s Business Cycle Dating Committee (BCDC) suggest a peak, although the critical indicator — nonfarm payroll employment — continues to rise, albeit slowly.
The gap between long-term and short-term interest rates has narrowed sharply over the last year and is now dipping into negative territory. Historically that’s often been a signal that slower economic growth or even an economic recession could lie ahead.
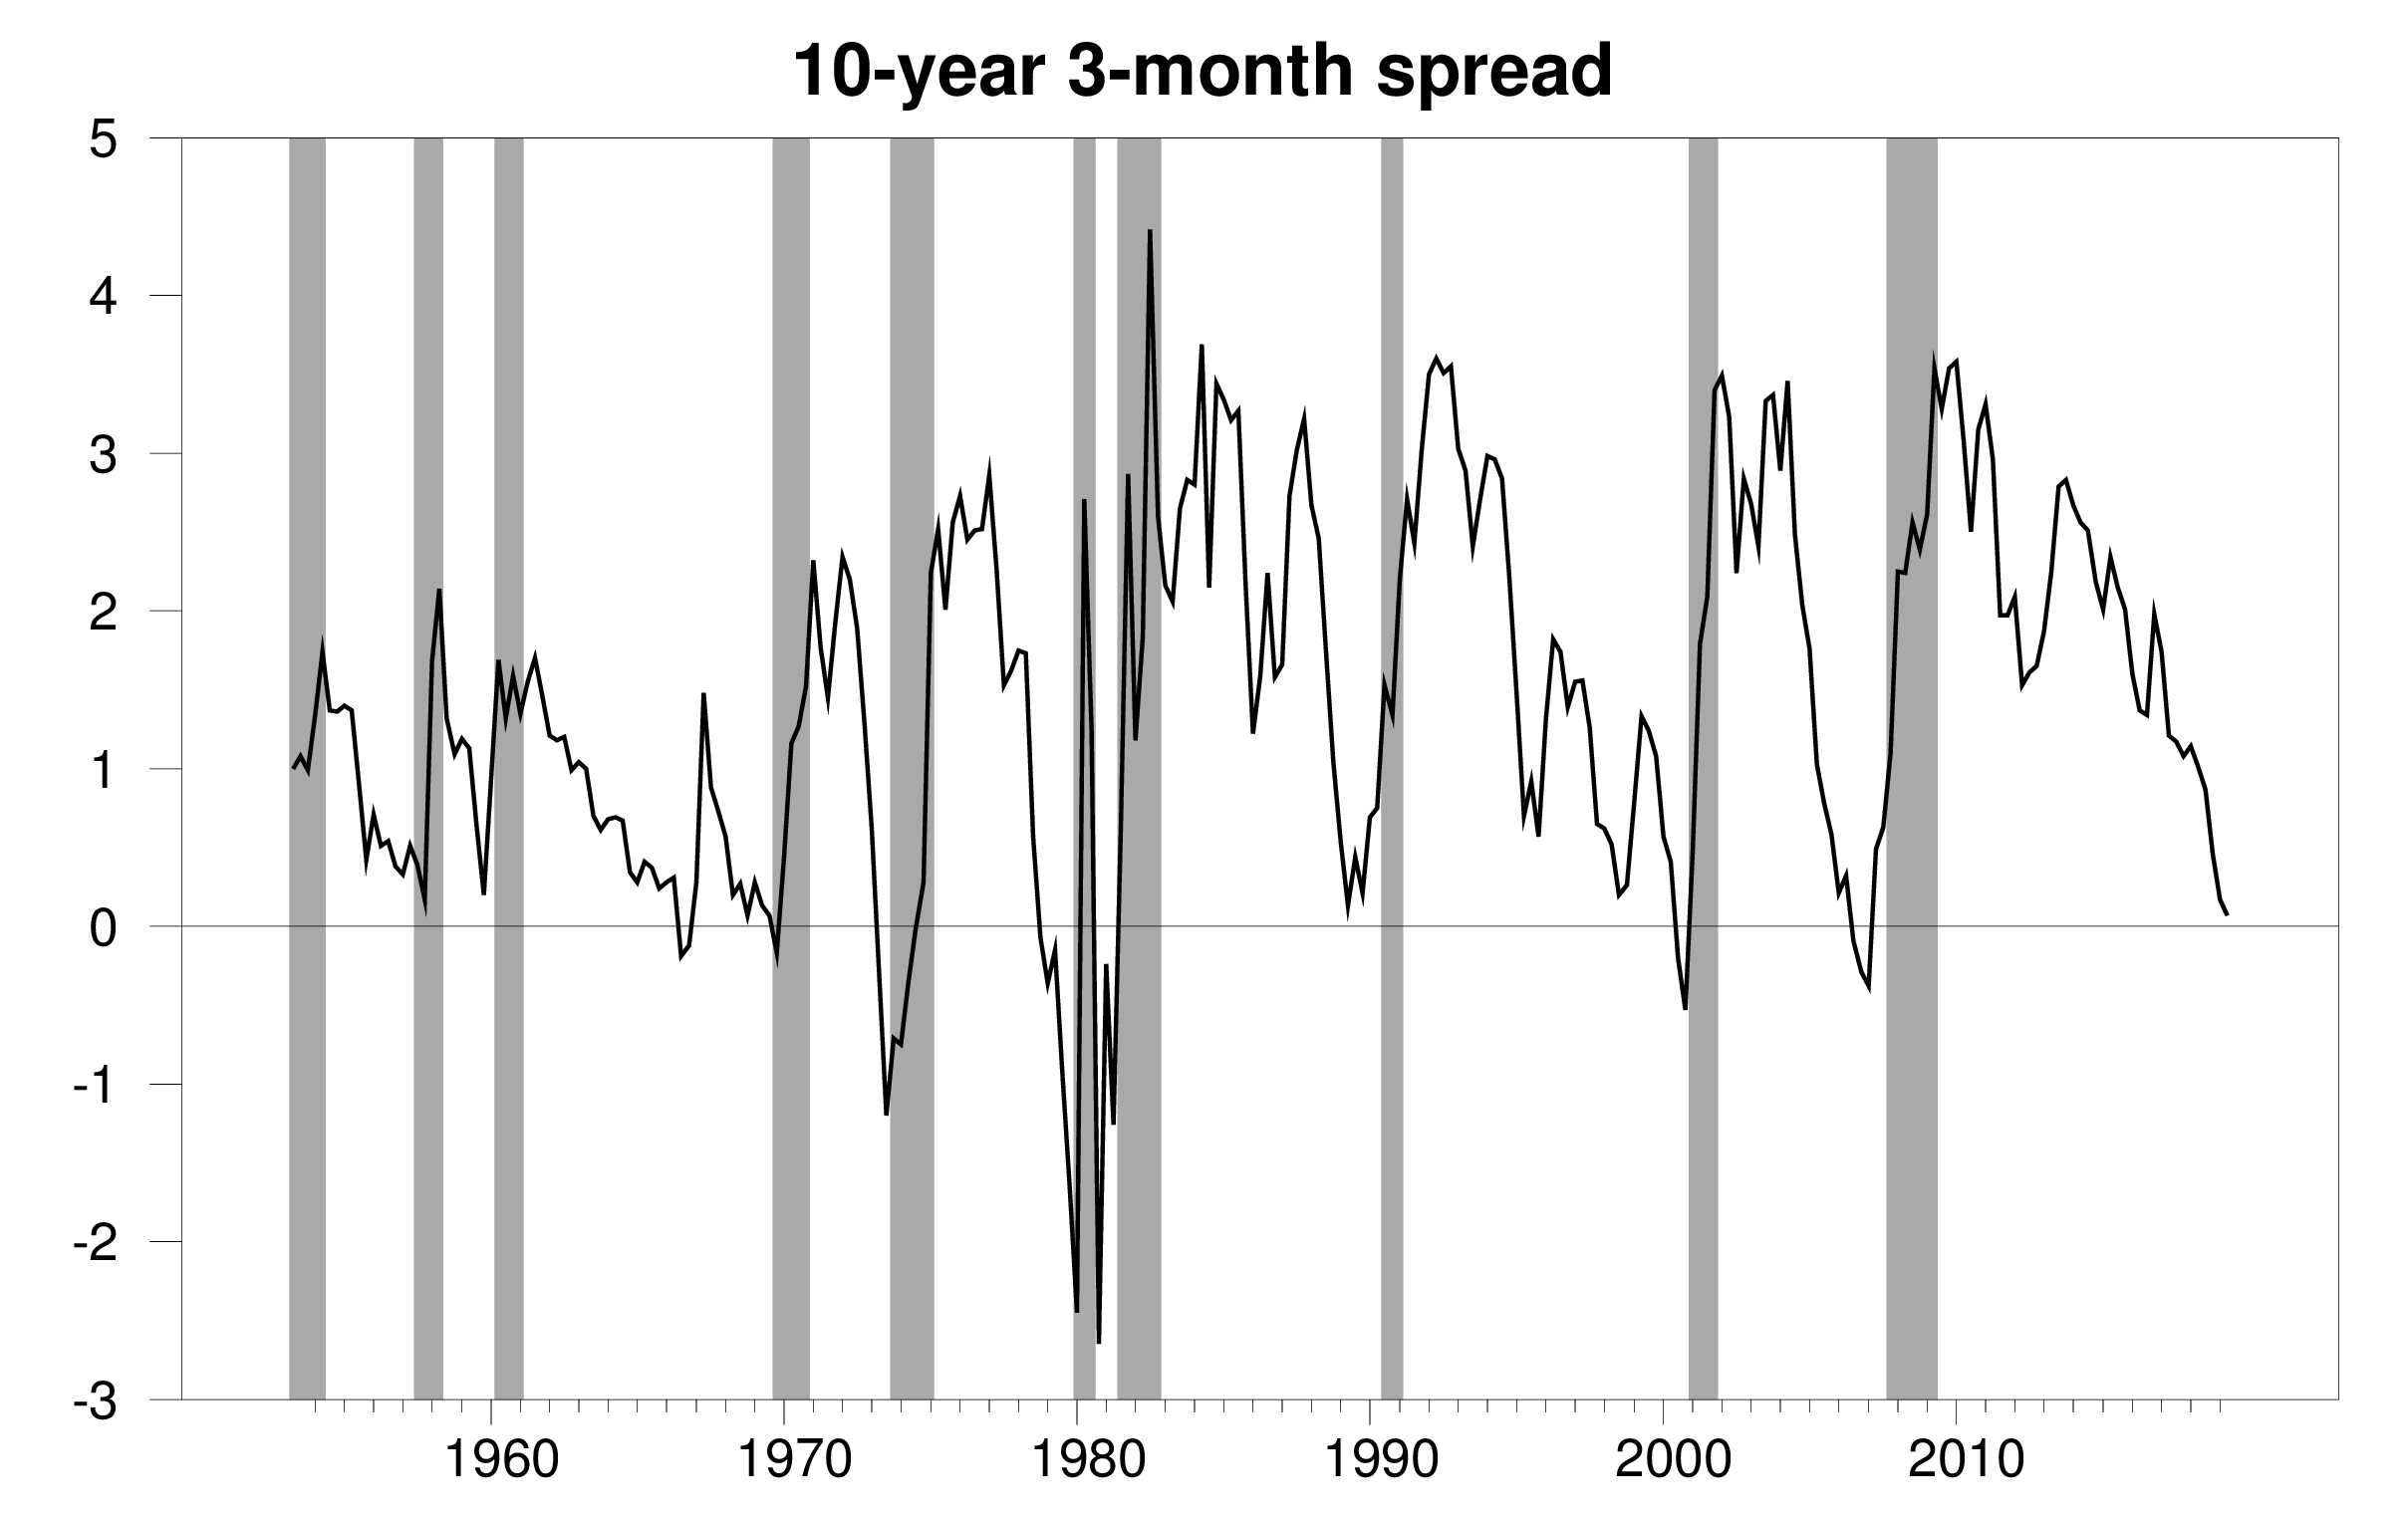
Gap between average interest rate on 10-year Treasury bond and 3-month Treasury bill during the last month of the quarter (1953:Q2 to 2019:Q1) and May 1-24 for 2019:Q2. NBER dates for U.S. recessions shown as shaded regions.
Several key series look like they have peaked; nowcasts indicate slowing growth. Forward looking indicators look “iffy”.

Figure 1: Nonfarm payroll employment (blue), industrial production (red), personal income excluding transfers in Ch.2012$ (green), manufacturing and trade sales in Ch.2012$ (black), and monthly GDP in Ch.2012$ (pink), all log normalized to 2019M01=0. Source: BLS, Federal Reserve, BEA, via FRED, Macroeconomic Advisers (5/3 release), and author’s calculations.
According to constant maturity rates reported by US Treasury, the 10 year-3 month yield curve was inverted as of today’s close (-0.01%). The 10 year-2 year spread is -0.22%, and the 5 year-3 month spread favored by Cam Harvey is -0.23%.
Robust GDP growth, employment rising on pace, perceived recession risk declining… as in this headline. The latest issue of the Economist has an article entitled Fears of recession have faded. But I’m reminded that Campbell Harvey, who wrote early papers on the subject of yield curve predictors, relies on the 5yr-3mo spread (for growth, not recession). And that implied specification signals 44% probability of recession in 2020M04.
That’s from Macroeconomic Advisers today. Turns out a bunch of monthly indicators have recently been released, including today’s employment report. Here are some key ones followed by NBER’s Business Cycle Dating Committee (BCDC).