After a hiatus of nearly 4 years, the Wisconsin Department of Revenue has resumed publication of the Wisconsin Economic Outlook, as of yesterday.
Category Archives: Wisconsin
What Did $1.4 Billion Buy in Manufacturing Employment?
Not much…Wisconsin manufacturing employment up to February; January revised down…
Employment Growth in the Last Year of Walker’s Wisconsin
Walker’s Wisconsin Manufacturing Renaissance Revised Away (Again)
Or. Oops. (Again).
What Has the Wisconsin Manufacturing and Agriculture Credit Wrought?
Has manufacturing value added increased above what was expected, in response to the (costly) Manufacturing and Agriculture Credit? Comparing against Minnesota (which did not implement such a measure) suggests no.
Wisconsin GDP ex-Madison ex-Milwaukee
Robin Vos has suggested Wisconsin would be much more Republican (hence “better”) without Madison and Milwaukee. I wondered what an ex-Madison and ex-Milwaukee Wisconsin economic output would look like. Here’s the picture.
Continue reading
Scott Walker’s Parting Gift to Wisconsin
A shrinking economy.
Wisconsin GDP Surge Revised Away
New figures released by the BEA, incorporating annual benchmark revisions, indicate Wisconsin has been growing more slowly than previously thought; Q/q growth in 2018Q2 was ranked 48th in the Union. This outcome is illustrated in the following map.
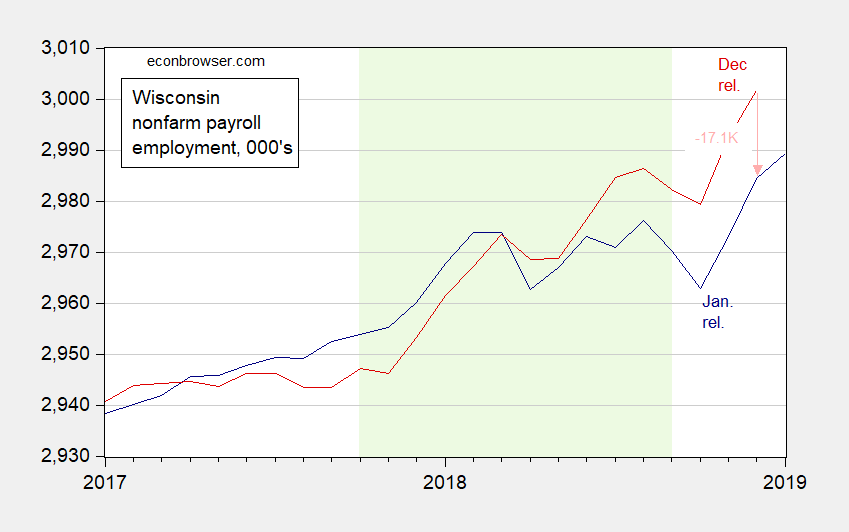
Wisconsin Employment Declines, Previous Revised Down
Figures released by DWD suggest a slowdown in Wisconsin.
Wisconsin and Her Neighbors: Coincident Indices
Cumulative growth in Wisconsin since 2017M01 lags Illinois, according to estimates released today. And the 2018M09 Wisconsin index is below peak (nobody else in the region is).
