Last semester, teaching the Financial System, I laid out three things that worried me: Crypto & stablecoins, private credit, and the AI boom. How’re things looking for the latter?
The Layoff Announcement-Labor Force Ratio and Recessions, 1989-2025
Using Challenger, Gray, Christmas data at quarterly frequency, normalized by civilian labor force.
Nowcasting January Private NFP
BLS will release (w/delay) on Wednesday. Until then, we have ADP (which underwent benchmarking). Using ADP data (2022M01-2025M12) to extrapolate the implied preliminary benchmark, we have the following picture:
USDA Forecasts Near Constant Farm Cash Income…As Long as We Dole Out $44.3 Billion
From USDA on Thursday:
Trade Balance ex-Gold
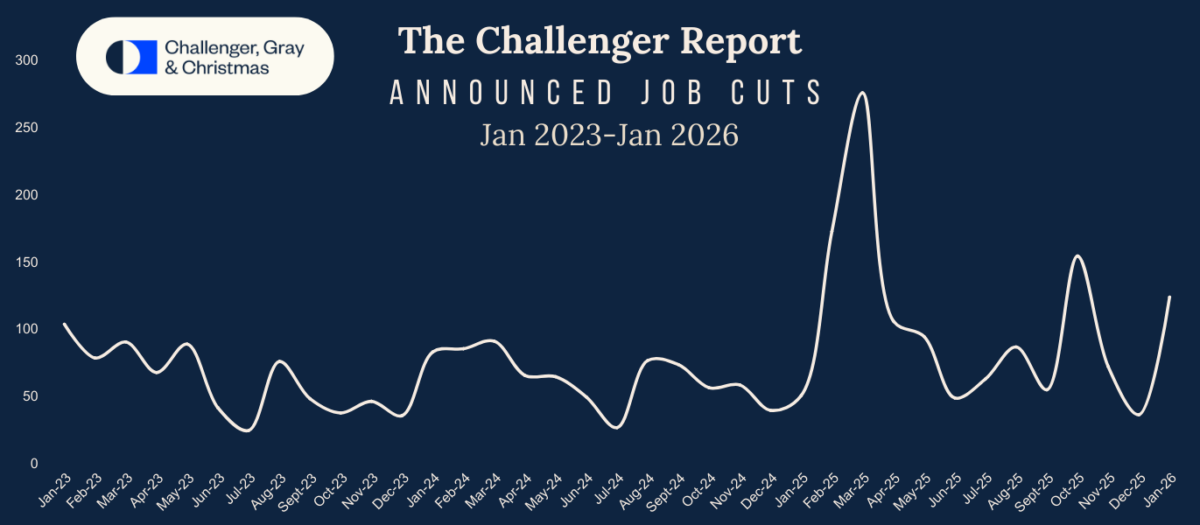
Layoff Announcements: Do they Lead Actual Layoffs?
Challenger, Gray and Christmas had a startling headline: “January Job Cuts Surge; Lowest January Hiring on Record”.
Source: Challenger, Gray and Christmas.
Guest Contribution: “Caligula Reincarnated”
Today, we present a guest post written by Jeffrey Frankel, Harpel Professor at Harvard’s Kennedy School of Government, and formerly a member of the White House Council of Economic Advisers. A shorter version was published in Project Syndicate.
Official GDP vs. Alternatives: China
Bank of Finland’s BOFIT concludes:
China’s National Bureau of Statistics (NBS) reports fourth-quarter growth of the Chinese economy slowed to 4.5 % y-o-y. Third-quarter GDP growth last year was still 4.8 % and first-half growth exceeded 5 %. The NBS data also indicate that consumption demand accounted for 2.4 percentage points of 4Q GDP growth, while net exports contributed 1.4 percentage points and investment demand 0.7 percentage point. GDP growth for all of 2025 (5.0 %) unremarkably matched the official “about 5 %” target announced at the National People’s Congress last spring.
BOFIT’s alternative GDP calculation suggests that economic growth for all of 2025 was roughly 1 percentage point below the official figure. The alternative GDP growth estimate for the fourth quarter was 3.3 %. Industrial output growth accelerated slightly in December from previous months to over 5 % y-o-y. For all of 2025, industrial output rose by roughly 6 % y-o-y. Foreign trade, which is closely linked to industrial output, remained strong throughout the year. Net exports clearly supported economic growth for the entire year.
Truflation Chief Economist: “Less Than 1 Percent Inflation? Yes.”
From Townhall today:
“When Tariffs Hit Home”
That’s the title of my “No Jargon” podcast on the Scholars Strategy Network, posted yesterday.
