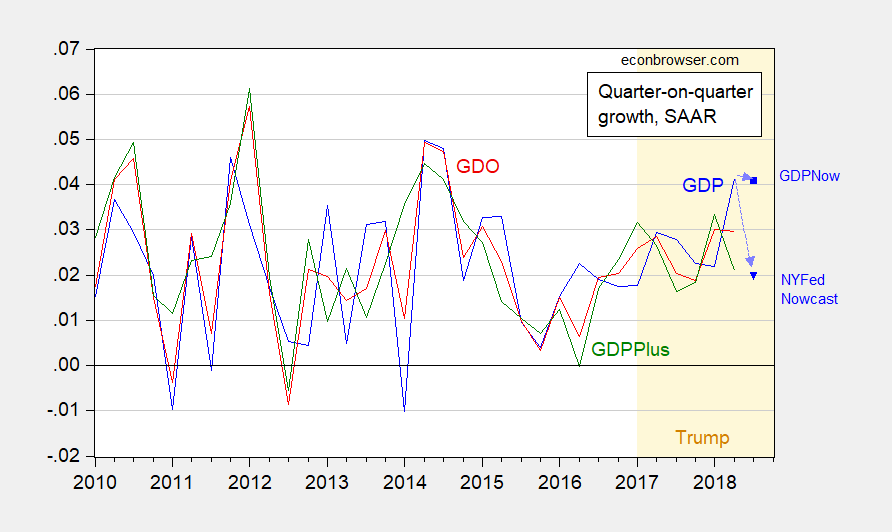
Figure 1: GDP (blue), GDO (red), and GDPPlus (green), q/q SAAR growth calculated as log diferences, and GDPNow (blue square) and NY Fed Nowcast (blue open triangle). Source: BEA 2018Q2 2nd release, Philadelphia Fed, Atlanta Fed (8/30),
NY Fed (8/31), and author’s calculations.
Thinking about that Surge in Growth
Two points from the 2018Q2 2nd release: GDO is smoother, and a breakout has not yet appeared.
Trumpification of USDA?
The demolishment of technocratic and research groups continues.
Continue reading
The Recovery in Agricultural Futures, Post-Tariff Imposition
Soybean harvesting begins soon, with the new market year (9/1-), and it was thought by some observers that as China would have to eventually access American soybeans, so prices would recover. That event has not occurred.
Continue reading
Guest Contribution: “The Next Recession Could Be a Bad One”
Today, we present a guest post written by Jeffrey Frankel, Harpel Professor at Harvard’s Kennedy School of Government, and formerly a member of the White House Council of Economic Advisers. This column is based on “The Next Economic Crisis,” remarks on a panel at the 2nd annual retreat of the American Enterprise Institute in Jackson Hole, Wyoming, August 13. A shorter version appeared in Project Syndicate.
An American Apocalypse in Puerto Rico: 2975 (95%CI, 2,658-3,290)
From Ascertainment of Estimated Excess Mortality from Hurricane Maria in Puerto Rico, commissioned by the government of Puerto Rico, released today:
Total excess mortality post-hurricane using the migration displacement scenario is estimated to be 2,975 (95% CI: 2,658-3,290) for the total study period of September 2017 through February 2018.
At the Current Pace, the 2-10 Will Invert in December
Holding to the Old Faith
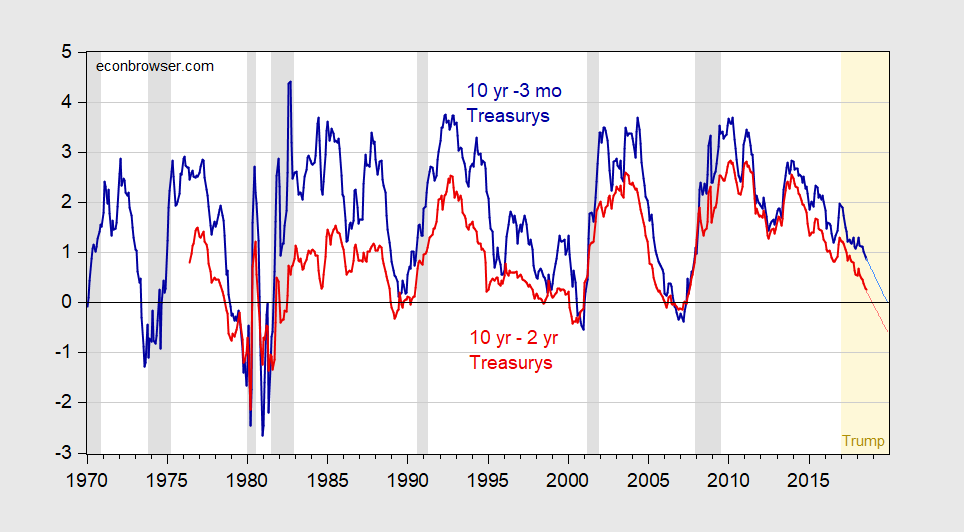
Figure 1: Ten year-3 month Treasury yield spread (bold dark blue), and ten year-two year Treasury yield spread (bold dark red), and projections at current pace using 2017M01-18M08 sample (light blue and pink lines), in percentage points. August 2018 observation through August 27th. NBER defined recession dates shaded gray. Light orange denotes Trump administration. Source: Federal Reserve Board via FRED, Bloomberg, NBER, author’s calculations.
Continue reading
Consumption under SuperSimple MicroFoundations
I’ve recently read some commenters talking about consumption behavior as if it’s a settled matter, particularly with respect to theory. Let me just put that idea to rest.
Continue reading
Guest Contribution: “Rising US Real Interest Rates Imply Falling Commodity Prices”
Today, we present a guest post written by Jeffrey Frankel, Harpel Professor at Harvard’s Kennedy School of Government, and formerly a member of the White House Council of Economic Advisers. A version appeared earlier on his blog.
The Closed Economy National Income Identity vs. Aggregate Demand
Assume a closed economy, no government spending and no taxes, and no depreciation. National income accounting states unambiguously:
C + I ≡ Y ≡ C + S