Mr. Moore continues his reign of (economic) errors, now tackling the CBO’s (and JCT’s) record on predictions, in “Save us from the CBO”
…Mr. Hassett uncovered an issue that has swerved Washington into bad policy for decades.
The most powerful forces on Capitol Hill aren’t the House speaker and Senate majority leader, they’re the CBO and JCT. These two unelected bodies forecast how legislation could change spending and revenue over the next decade. Too often, these predictions are wildly off base.
Before turning to the substance of his allegations, it’s useful to remember that Mr. Moore (he doesn’t have a Ph.D., I suspect he’s never been to the modest office of the CBO) has made the following assertions.
Stephen Moore Lies and Lies and Lies (and Hence Belongs in the Trump NEC)
Stephen Moore: “When It Comes To Electric Power, Coal Is No. 1”
Stephen Moore’s Analysis of Income Taxes and Employment Growth
Homosocial Reproduction and Economic Policy Formulation in the White House
State Employment Trends: Does a Low Tax/Right-to-Work/Low Minimum Wage Regime Correlate to Growth?
Back to projections. As far as I know, I have a JCT (not CBO, although reported in a CBO document) estimate of deviations from baseline:
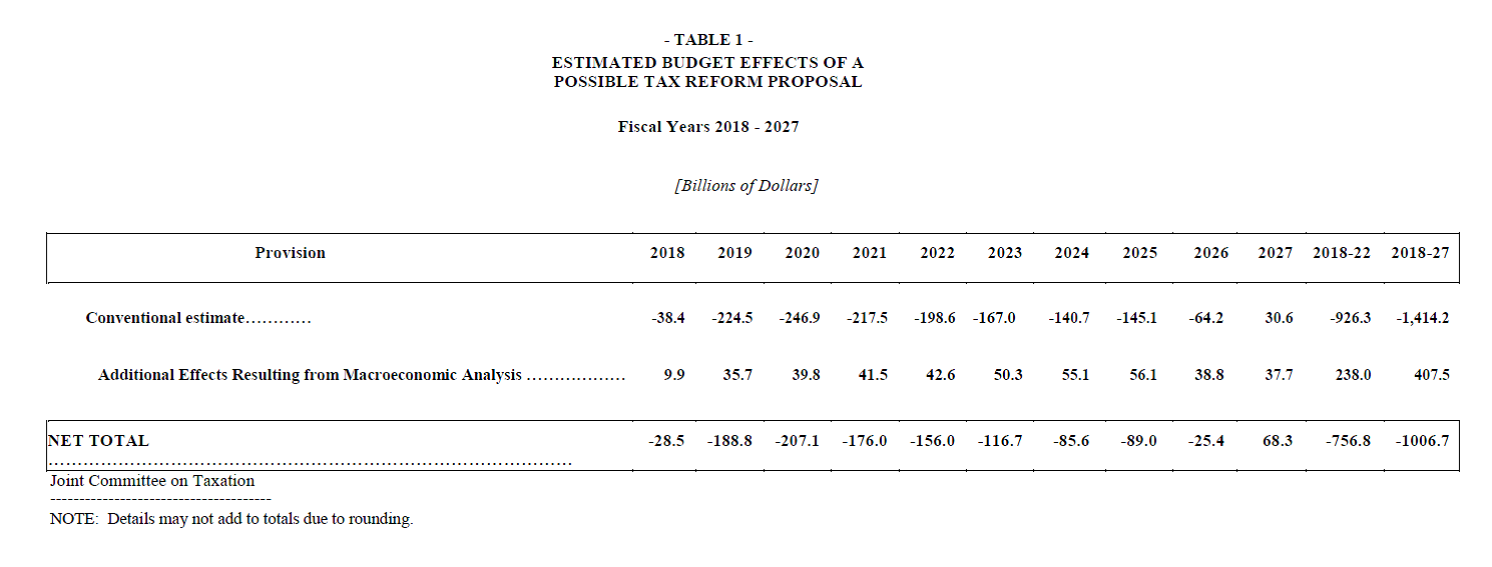
Source: JCT (November 30, 2017).
I don’t know in what way Mr. Moore knows CBO’s estimate of “fiscal effects” is understated, as he doesn’t cite a study, does not show a calculation, and does not indicate whether the underestimate is over a 5 year or 10 year horizon. There is an evaluation of Administration vs. CBO revenue projections, which did not show a serious deficiency of the CBO revenue estimates in FY2018-2019. Hence, given Mr. Moore’s penchant for data errors, I would be wary of taking his assertions at face value.
I do know that CBO projections of nominal and real GDP and inflation are comparable to those of the Blue Chip forecasts, and slightly less than that of administration, over decades (see this 2023 CBO assessment).
Here’s CBO vs. Trump administration (incorporating JCTA).
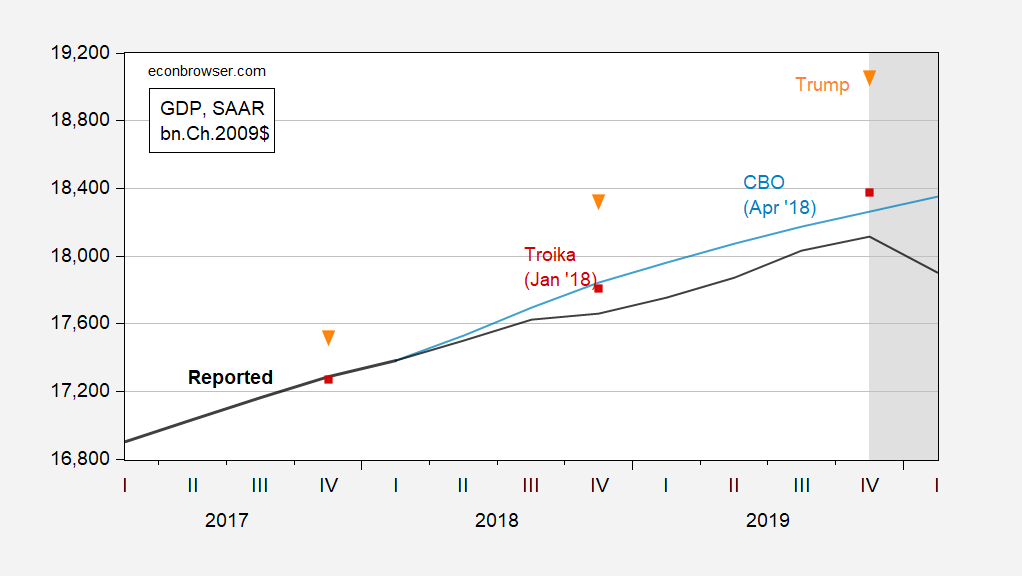
Figure 1: GDP (black), CBO (light blue), Troika/Administration (red square), Donald Trump (orange inverted triangle), all in bn.Ch.2009$ SAAR. NBER defined peak-to-trough recession dates shaded gray. Source: BEA, CBO (April 2018), Economic Report of the President, 2018, CNBC, NBER, and author’s calculations.
The JCT link returns “Page Not Found”.
Forecasting is hard, especially if you are Mr. Moore or Mr. Hassett.
Mr. Moore should refer to “Mr. Hassett” as Dr. Hassett thank you. Of course the latter has learned Moore’s trick of smiling a lot as he too lies like a rug.
This is the same old “dynamic scoring” complaint going way back 25 years to the Bush days. They still insist, against all the empirical evidence, that tax cuts pay for themselves. Remember that the first balanced budget in decades occurred after the Clinton tax increases and was rapidly reversed into record deficits after the Bush tax cuts.
As for bias, keep in mind that the director of the Congressional Budget Office is Republican Phillip Swagel. The chairmen of the Joint Committee on Taxation are Republican Jason Smith in the House and Republican Mike Crapo in the Senate.
Speaking of forecasting, I’ve seen some comment on yesterday’s Q1 corporate profits data suggesting hints of an economic slowdown. Reuters reported that profits declined “sharply”. Have to say, I don’t see it. Here’s the picture of the % change in after tax profit:
https://fred.stlouisfed.org/graph/?g=1JmcC
A 1% decline is common as anything, with considerably larger declines happening often mid-cycle. Declines are particularly common following a big rise, like the 6.7% gain in Q4. Compared to a year ago, after tax profits were up 8.4%. Reuters, by the way, uses a different measure of profits, one which fell considerably more – still within normal mid-cycle behavior, but bad if repeated in coming quarters.
Remember all that inventory piled up in Q1? That was a drag on profitability, and seems to have been a walk in the park. Tariffs arrive, sort of, in Q2. We’ll see what that does in about 3 months.
Also, courtesy of Dean Baker, it should be pointed out that, quite contrary to Moore’s complaints that the CBO always under projects GDP growth, in 2017 the CBO over projected the growth for Trump’s first tax cut. The CBO projected 3.0% for 2018 and 2.9% for 2019. Actual GDP growth came in as 3.0% and 2.6%. Clearly CBO was too optimistic. These whiny folks can’t even get their story straight.
Off topic – that war in that country we apparently don’t care much about? Gonna get worse:
https://www.reuters.com/business/aerospace-defense/zelenskiy-says-russia-has-gathered-50000-troops-offensive-northern-ukraine-2025-05-28/
Looks like a new front is about to open up. Pushing 50,000 troups in that direction doesn’t look like the tired old war of attrition. It’s a grab for more land before a “peace” deal.
Dynamic scoring. I sorta remember that gibberish coming out of the reagan administration when they claimed their tax cuts would pay for them selves. they didn’t and the deficit rose!
When Douglas Holtz-Eakun ran the CBO, he kindly obliged the GOP caucus by running a handful of dynamic scoring models on the budget of the day. He and his colleagues published their findings, which showed either a very small improvement in the deficit vs non-dynamic modeling, a very small deterioration, or not much difference. The GOP caucus was not amused, and he’s on their side.
Infact, ine of the strongest arguments that dynamic scoring might be a good idea is the results Holtz-Eakin published. One assumption required by this argument is that future CBO directors will be as honest as Holtz-Eakin was. Have a look at what Congress, and the felon-in-chief, have been up to and see if you feel comfortable with that assumption.
Here’s one of Holtz-Eakin’s papers in dynamic scoring:
https://onlinelibrary.wiley.com/doi/10.1002/pam.21864
Macroduck: Also, as I have noted elsewhere, why only dynamic score tax revenues? How about spending (e.g., infrastructure investment)?
Absolutely!