CBO released an Update to its Budget and Economic Outlook, while the IMF released a mission concluding statement for its Article IV review of the United States. Here are the implied GDP levels for year-end 2021 [and updated CBO potential GDP, h/t Paweł Skrzypczyński]
Category Archives: recession
Business Cycle Indicators as of July 1
IHS-MarkIt monthly GDP for May down 0.1%, while Bloomberg consensus for June nonfarm payrolls is for a 700K increase.
Business Cycle Indicators as of June 27
Personal income and consumption for May were released last week, as well as the April manufacturing and trade industry sales figure.
Business Cycle Indicators, Mid-June (and Retail Sales)
Industrial production was released yesterday, along with retail sales.
Where to Find Business Cycle Dates for Different Economies
Using (roughly) the Burns-Mitchell-NBER approach. Incomplete listing, focused on those updated over time, by agencies, firms, or other organizations.
Business Cycle Indicators as of June 1
Monthly GDP figures were released by IHS-Markit today, showing a rebound in April. In the context of key macro indicators followed by the NBER Business Cycle Dating Committee:
Business Cycle Indicators and Inflation, End-May 2021
April personal income and consumption figures were released today, along with real manufacturing and trade industry sales. Here’s a depiction of these figures in the context of key macro indicators followed by the NBER Business Cycle Dating Committee:
Economy looks strong
The Bureau of Economic Analysis announced today that seasonally adjusted U.S. real GDP grew at a 6.4% annual rate in the first quarter, well above the 3.1% average growth that the U.S. experienced over 1947-2019.
Nowcasts, Economic Indicators, Expectations
On the eve of the advance GDP release for Q1.
Business Cycle Indicators as of Mid-April
Industrial production figures were released today, showing a rebound in March. In the context of key macro indicators followed by the NBER Business Cycle Dating Committee:
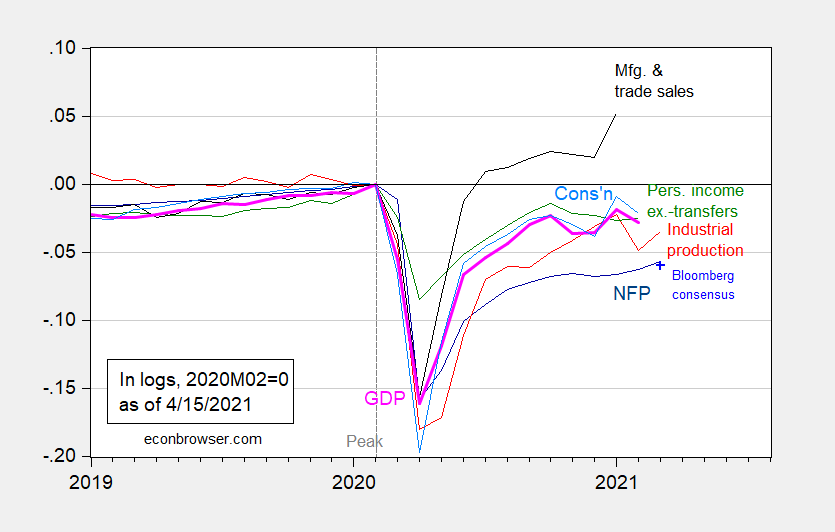
Figure 1: Nonfarm payroll employment from March release (dark blue), Bloomberg consensus as of 4/1 for March nonfarm payroll employment (light blue +), industrial production (red), personal income excluding transfers in Ch.2012$ (green), manufacturing and trade sales in Ch.2012$ (black), consumption in Ch.2012$ (light blue), and monthly GDP in Ch.2012$ (pink), all log normalized to 2020M02=0. Source: BLS, Federal Reserve, BEA, via FRED, IHS Markit (nee Macroeconomic Advisers) (4/1/2021 release), NBER, and author’s calculations.
Industrial production was whipsawed by weather in February, so it makes sense to look at manufacturing production as well. Seasonally adjusted industrial production rose 1.4% vs. 2.8% for manufacturing production (18.7% vs. 39.1% annualized). Industrial production is 3.4% below levels at NBER peak (2020M02), while manufacturing is 1.7% below. Incidentally, neither has re-attained the local maxima in January 2021.
Atlanta Fed GDPNow (4/15) is for 8.3% in Q1; IHS Markit nowcast (4/15) is 6.0% (both figures SAAR).