A 2.6% q/q dive in Chinese GDP is unsurprising, but unwelcome nonetheless:
Another Quarter of Negative Growth?
The Atlanta Fed’s nowcast for Q2 as of 7/15 was for -1.5% Q/Q SAAR. What does this tell us about what is likely to be the advance print, and then subsequent releases.
Guest Contribution: “The Fed Fell Behind the Curve by Not Following its Own Policy Rules”
Today, we present a guest post written by David Papell and Ruxandra Prodan, Professor and Instructional Associate Professor of Economics at the University of Houston.
Business Cycle Indicators, Mid-July
Industrial production and manufacturing production both came under Bloomberg consensus (-0.2% m/m vs. +0.1, -0.5% vs. +0.1, respectively). With these data, we have this picture of some key indicators followed by the NBER BCDC.
Texas: Peak Load Use and Renewables
In response to the post on the causes of the Winter 2021 energy debacle in Texas, reader Corev confidently asserts:
Solar can never supply the power needed during peak demand. Peak demand occurs as the Sun diminishes.
Always useful to look at actual data. Here is a picture of peak load use in Texas on June 13th, 2022:
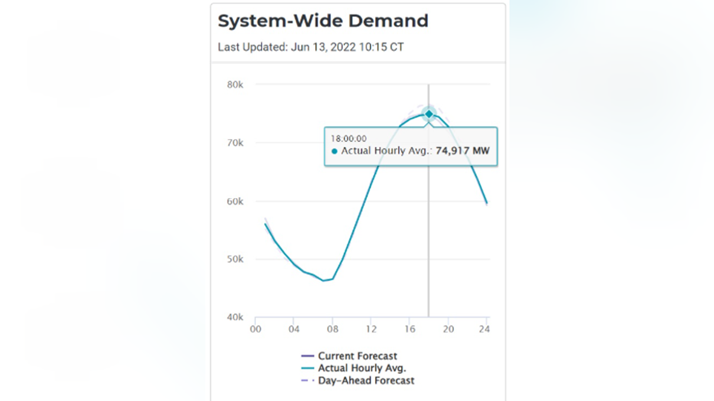
Source: Fox7Austin.
Peak use was at 6pm CST.
Sunset in Houston on June 13th was 8:23pm CST.
Of course, the entire point of the post was how renewables (including wind) were mitigating, not exacerbating, the difficulties Texas was encountering in meeting demand. Renewables includes wind, and wind accounts the great bulk of renewables energy production in Texas.
This is not to say that there are no problems with reliance on renewables; as pointed out in the Dallas Fed article, greater ability to transmit electricity (i.e., making the electricity generation more tradable, in essence) and greater battery storage capacity (which is coming) are going to be essential to meeting greater and more variable demand as climate change continues.
In the meantime, keep a watch out for utter failures of fact peddled by purveyors of disinformation.
Texas Electricity Generation in Crises
IMF Forecast for US GDP: No Recession
From the Article IV consultation:
Nonresidential Fixed Investment and Prospects for GDP Outlook and Revisions
One of the interesting aspects of the current recovery is the relative small rebound in nonresidential fixed investment.
Gasoline Prices Continue to Fall
Why is no mystery:
Why I Suspect Q1 GDP Will Eventually Be Revised Up
First, look at nonfarm payroll employment and industrial production, as compared to GDP (and GDO):