By April 2018, the Tax Cut and Jobs Act and the Bipartisan Budget Act of 2018 had been put into law. The CBO projected a bump in GDP growth, relative to counterfactual. (According to the CBO, the TCJA alone should have pushed output 0.6 percentage points above baseline in 2019.) However, the actual record has been fairly plodding, as shown in the below figure.
Where’s That 4% Growth Trump Promised (or For That Matter, 5%)?
We have two and a half years of observations on GDP, and a couple quarters of nowcasts, to consider. (And if you’re planning to pull a “Mick Mulvaney” and say Trump never predicted 4% or 5%, see here.)
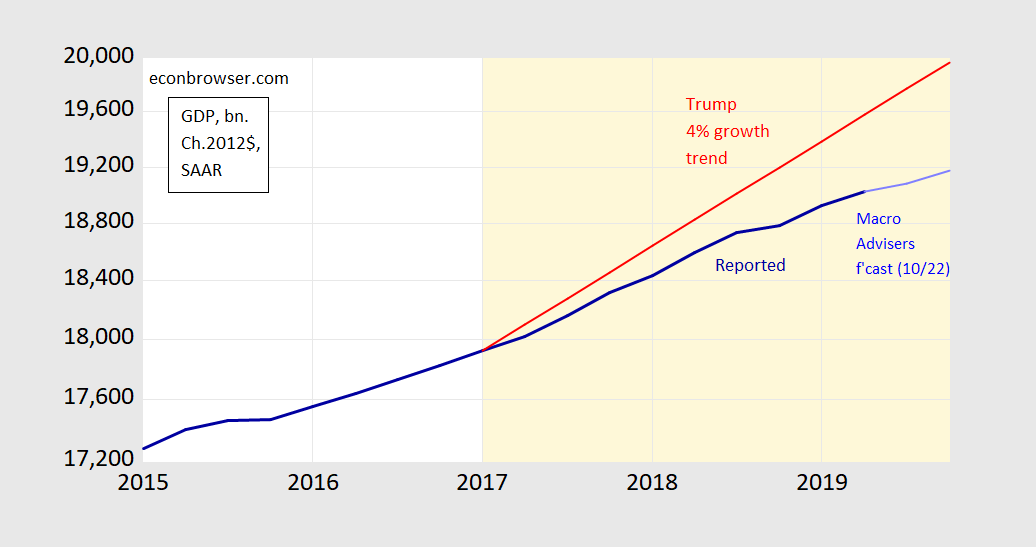
Figure 1: GDP in bn. Ch.2012$, SAAR (dark bold blue), Macroeconomic Advisers nowcasts (light blue), and 4% trend (red), all on log scale. Light orange shading denotes Trump administration. Source: BEA, 2019Q2 3rd release, Macroeconomic Advisers (10/22), and author’s calculations.
Well, I’ll file this prediction with “The Kurds are happy” and “phoney emoluments” clause.
Presentation: “The Economic Consequences of Trump’s War on Multilateralism”
Here is a link to my October 18th Global Hot Spots talk, sponsored by the Wisconsin Foundation and Alumni Association.
What Does It Mean to Say Futures Contracts Forecast?
Despite repeated explanations, some readers still don’t understand futures contracts and forecasting exercises. One point of Chinn-Coibion (2014) is that at the one year horizon, the best predictor of future soybean prices at a one year horizon is the futures contract expiring one year ahead.
Manufacturing Output under Last Obama Term, Now
So much misleading prose circulates these days:
“Manufacturing came back quickly after the recession as it has done in prior recessions, but then flattened out and declined during Obama’s second term.”
Victory at Sea: Soybeans heading to China (from Brazil)
Reuters: After trade talks in U.S., China ramps up Brazilian soy purchases:

Nearest month futures are about a dollar lower (at $9.34/bushel) than the nearest month futures on the day when Trump announced Section 301 action against China.
Michigan, Pennsylvania and Wisconsin Manufacturing Employment Contraction Accelerates
The contrast with national manufacturing employment (total, not just production and nonsupervisory, which is declining).
The Manufacturing Downturn Compared to 2014-16
In 2014-16, production and non-supervisory employment continued to rise even as hours and production declined. In 2018-19 (as discussed here), all three have declined relative to peak.
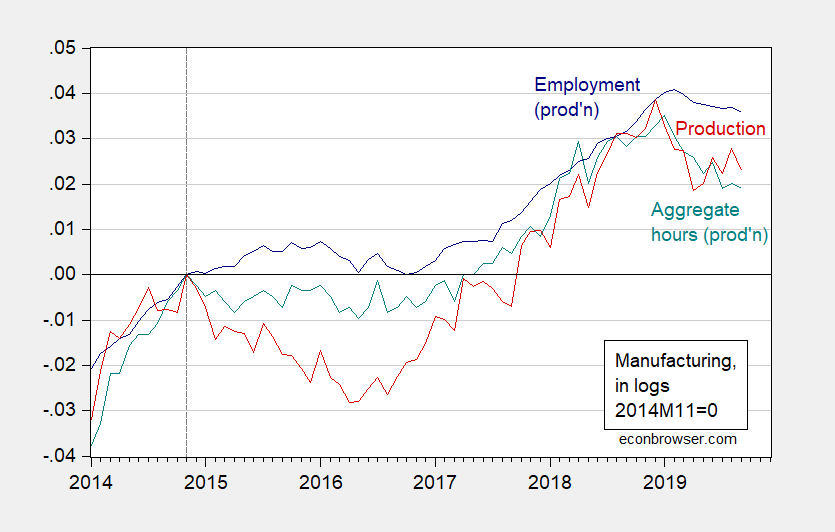
Figure 1: Manufacturing employment – production and nonsupervisory workers (blue), aggregate hours (teal), manufacturing production (red), in logs 2014M11=0. Source: BLS, Federal Reserve Board, via FRED, and author’s calculations.
Manufacturing in September
Production, employment (production & nonsupervisory), and aggregate hours are all declining, and all down relative to recent peak.
The Yield Curve Has Dis-Inverted. Are We Safe Now?
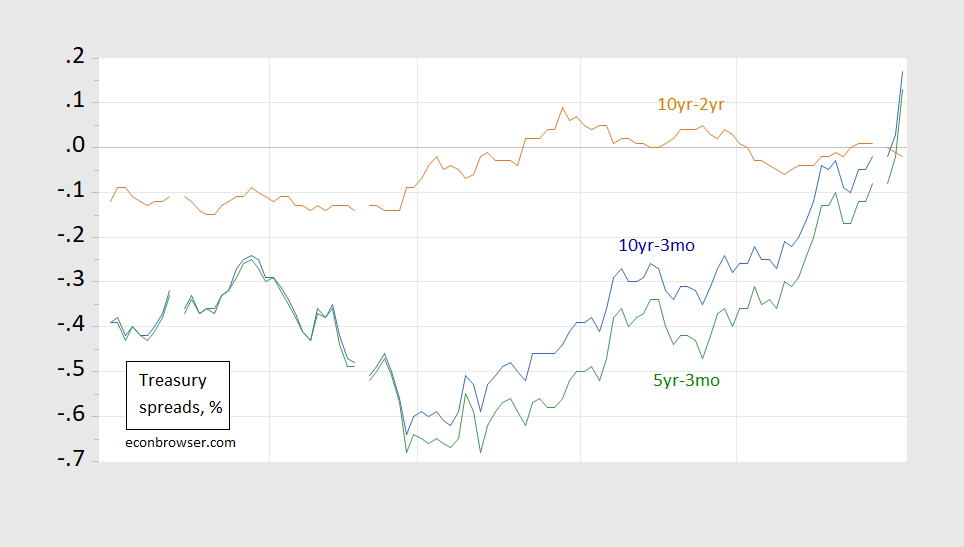
Figure 1: 10 year-3 month constant maturity Treasury spreads (blue), 10 year-2 year (red), 5 year-3 month (green), in %. Source: Federal Reserve, Treasury.