The economic policy uncertainty, that is (With apologies to Susan Powter). Regardless of where you are on the econo-political spectrum, you should want economic policy uncertainty to be reduced. Remember all those conservative voices in the post-Global Financial Crisis saying policy uncertainty was slowing the economic recovery? Well, today is an opportunity to return considered, coherent, economic policymaking and trade negotiations.
Trends in Covid-19 New Cases, Current Hospitalizations, and Deaths
It seems to me unlikely, looking at correlations and lags, that we are indeed “rounding the corner” on the pandemic.
Of Cumulatives and Count Biases
Reader Bruce Hall declares:
When adjusting for population, the number of new infections in Europe has now overtaken those in the United States, with Europe reporting 231 new Covid-19 cases per 1 million people, based on a seven-day average, compared with 177 new Covid-19 cases per 1 million people in the U.S. Overall, Europe, which includes 27 European Union countries and the U.K., is seeing nearly 120,000 new cases per day, Johns Hopkins data shows. https://www.cnbc.com/2020/10/20/covid-is-accelerating-across-the-globe-as-us-and-europe-head-into-flu-season.html
Covid-19 Weekly Fatalities and Excess Fatalities
Fatalities are likely rising; CDC determined fatalities consistently below alternative estimates in recent weeks; excess fatalities are revised upward (a lot, again).
Fernandez-Villaverde and Jones: “Macroeconomic Outcomes and COVID-19: A Progress Report”
From NBER WP 28004:
Our main finding is that most countries/regions/cities fall in either of two groups:
large GDP losses and high fatality rates (New York City, Lombardy, United Kingdom,..)
or low GDP losses and low fatality rates (Germany, Norway, Kentucky, …). Only a few
exceptions, mainly California and Sweden, depart from this pattern.
Business Cycle Indicators, October 30th
With the release of personal income and sales figures today, we see the continued deceleration in economic activity continues, according to some key indicators noted by the NBER’s Business Cycle Dating Committee (BCDC).
Guest Contribution: “Biden’s Better on Economics”
Today, we present a guest post written by Jeffrey Frankel, Harpel Professor at Harvard’s Kennedy School of Government, and formerly a member of the White House Council of Economic Advisers. A longer version appeared at Project Syndicate and the Guardian.
Record-breaking increase in GDP
The Bureau of Economic Analysis announced today that seasonally adjusted U.S. real GDP grew at a 33.1% annual rate in the third quarter. That’s the largest change ever recorded, even bigger than the -31.4% annual rate now reported for 2020:Q2. What do those numbers tell us?
Continue reading
(Non)Diversity in Econoblogging
The issue of diversity in economic discourse has occupied a prominent place over the past few years. The AEA has had long running initiatives to broaden the diversity of individuals in the economics professions, along gender, racial and ethnic lines, but it’s fair to say they have become much more visible as the debate has waxed: https://www.aeaweb.org/resources/best-practices . The last AEA conference had a panel devoted to the topic of racial diversity (video) . A good summary of the argument for promoting diversity in the economics profession is provided by Janet Yellen. A forceful statement on the economics professions gender diversity problem is here.
What about the EconoBlogosphere (or what remains of it)?
What Are Current Borrowing Costs for the Federal Government?
Remember Δbt = (r-g)bt-1 + deft , where b is debt/GDP, r is the real interest rate, g is the GDP growth rate, and def is the primary budget deficit/GDP ratio. What’s r?
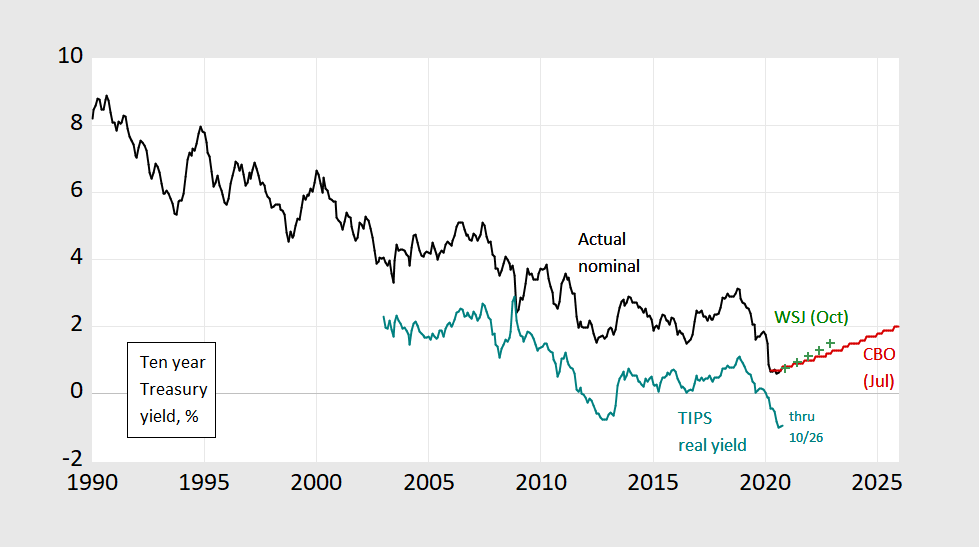
Figure 1: Ten year constant maturity Treasury yield (black), WSJ October survey mean forecast (green +), CBO July projection (red), and ten year TIPS (teal), all in %. October 2020 is data through 10/26. Source: Federal Reserve via FRED, WSJ, and CBO.