Recovery in Wisconsin has brought real GDP back to within 4% of peak levels.
Guest Contribution: “The US consumer benefits from Chinese imports”
Today, we are pleased to present a guest post written by Liang Bai (University of Edinburgh) and Sebastian Stumpner (Banque de France). The views presented represent those of the authors, and not necessarily those of the institutions the authors are affiliated with.
“In Memory of Richard Cooper”
By Jeffrey Frankel, December 24, 2020.
Business Cycle Indicators as of December 23
Key indicators tracked by NBER Business Cycle Dating Committee (BCDC) show mixed behavior; income (ex-transfers) declines. So too does consumption.
Quick Primer on Stock Market vs. GDP
The stock market booms while GDP staggers along. Why?
Wisconsin Employment Decline Continues
DWD data indicates nonfarm payroll employment declines in November, as does private nonfarm employment. Government employment also declines, while manufacturing versus accommodation/food services experience diverging fortunes.
Treasury’s FX Report – Currency Manipulation versus Currency Misalignment
The Treasury’s semi-annual report designated Switzerland and Vietnam as currency manipulators. Without taking a definitive stand on currency manipulation, I do want to highlight where Vietnam (and Switzerland) stand if evaluated by the Big Mac Parity/Penn Effect:
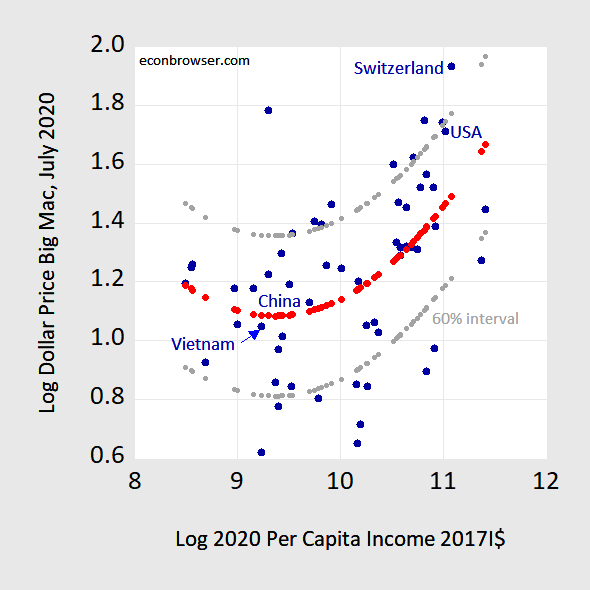
Figure 1: Log Big Mac dollar price in July 2020 plotted against log 2020 per capita income in 2017 I$. Penn Effect line estimated using regression (red) and 60% prediction interval (gray). Source: Economist, IMF World Economic Outlook October 2020 database, author’s calculations.
Treasury’s Semi-annual Foreign Exchange Report
Debasing the Dollar? (Or Inflation Looming, Again?)
Worried about currency debasement? Do we find out anything from the nominal exchange rate? In a flexible price monetary model (sometimes called the monetarist model of the exchange rate), changes in the money supply should be immediately reflected in the exchange rate.
Inflation Looming? Phillips Curve vs. Quantity Theory
Look at this:
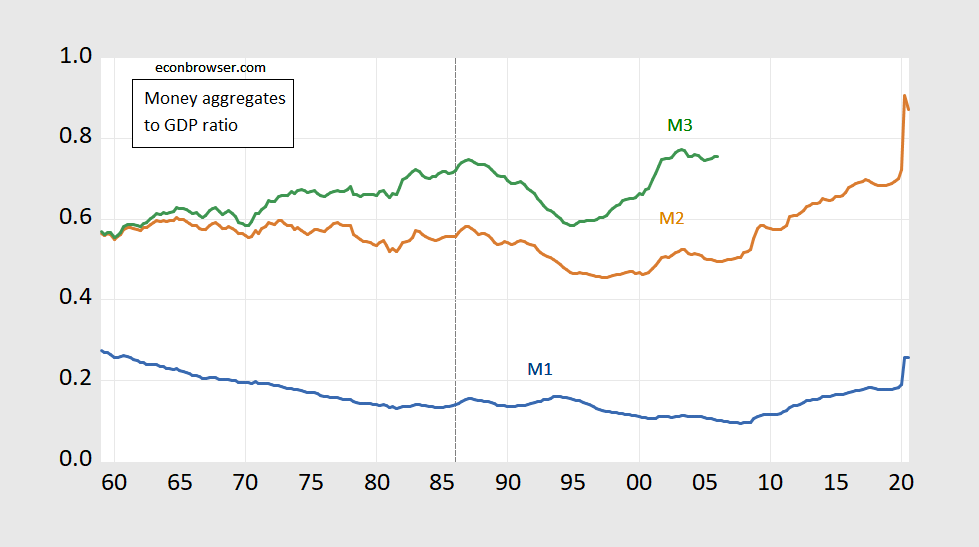
Figure 1: Ratio of M1 to real GDP (blue), of M2 to real GDP (brown), of M3 to real GDP (green), 1959Q1-2020Q3. Quarterly money data average of end of month data. Source: Federal Reserve via FRED, and BEA, 2020Q3 2nd release, and author’s calculations.