What prompted this question was seeing this release from Senator Portman (as well as this tweet) extolling the Tax Cuts and Jobs Act, appealing to the opinion of “137 economist”. Here’s the list:
Leontiev Lives! In Wisconsin
The MacIver Institute has released new projections of the impact of the Tax Cuts and Jobs Act on Wisconsin:
Continue reading
Brownback’s Regime in Long Term Context
It looks even worse than shown in this post.
Term Papers Due this Friday
Kansas and Missouri GDP Trends since Brownback
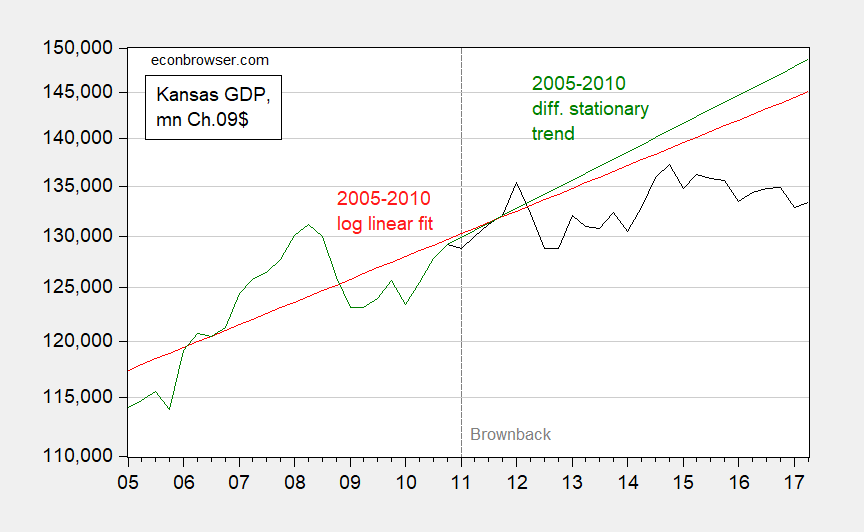
Figure 1: Kansas real GDP in mn.Ch.2009$ SAAR (black) and log linear deterministic trend based on 2005-2010 (red), a log difference stationary fit* (green) all on log scale. Source: BEA and author’s calculations.
“Financial Spillovers and Macroprudential Policies”
That’s the title of a new paper by Joshua Aizenman, Hiro Ito and me.
Wisconsin Output since Implementation of the MAC
The Manufacturing and Agriculture Credit, that is.
Continue reading
Wildfires: Acres Burned to Date
Not a record year yet, but still devastating. The upward trend in acres burned is shown below.
Continue reading
Post-War, How Many Times Has the 10yr-3mo Spread Fallen below 1% Without a Recession Following?
Three times.
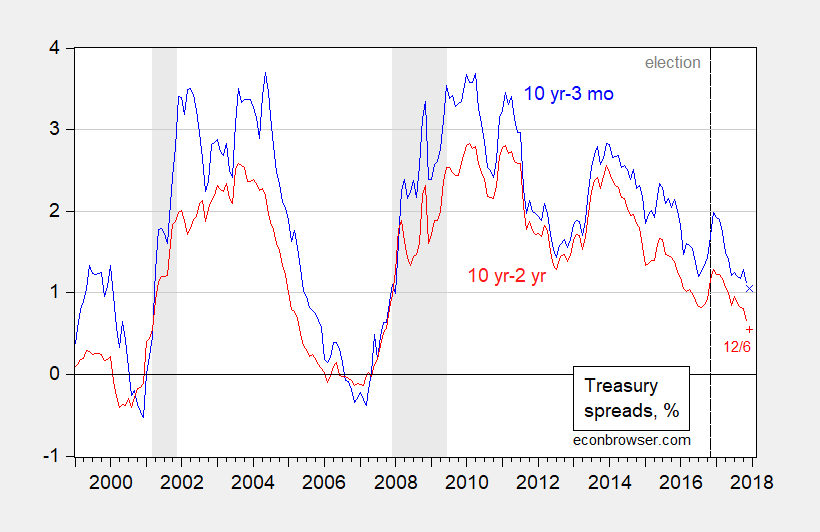
Figure 1: Ten year minus three month Treasury spread (blue), and ten year minus three month Treasury spread (blue). December observations pertain to 12/6 daily observation. NBER defined recession dates shaded gray. Source: Federal Reserve via FRED, NBER and author’s calculations.
“We have trade deficits with everybody”
Thus spake the Mr. Trump, on a day that the October trade figures were released, indicating a deteriorating balance.
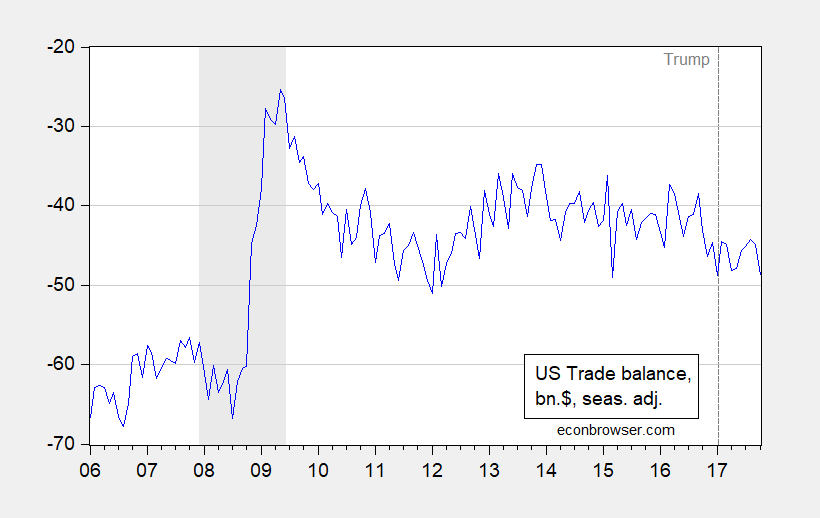
Figure 1: US trade balance, in billions $, seasonally adjusted (blue). NBER defined recession dates shaded gray. Source: BEA/Census via FRED, and NBER.
Continue reading