A recent White House internal memo has suggested a causal relationship between the decline in manufacturing jobs and a host of social ills, including the opioid epidemic. Here is a graphical/geographic comparison of two variables that are related to these factors.
Recession Watch, October 2017
Where do we stand?
Guest Contribution: “10 Lessons for China 10 years after the subprime financial crisis “
Today we are fortunate to present a guest contribution written by Alessandro Rebucci, Associate Professor, and Jiatao Liu, at the Carey School of Business at Johns Hopkins University.
Continue reading
A Curiously Non-Quantitative Assessment of Deregulation Effects on Economic Growth
And a funny choice of citations.
Two Pictures from the September Employment Situation
Consensus (Bloomberg) had been for +100,000 (range 0 to 140,000); print was -33,000.
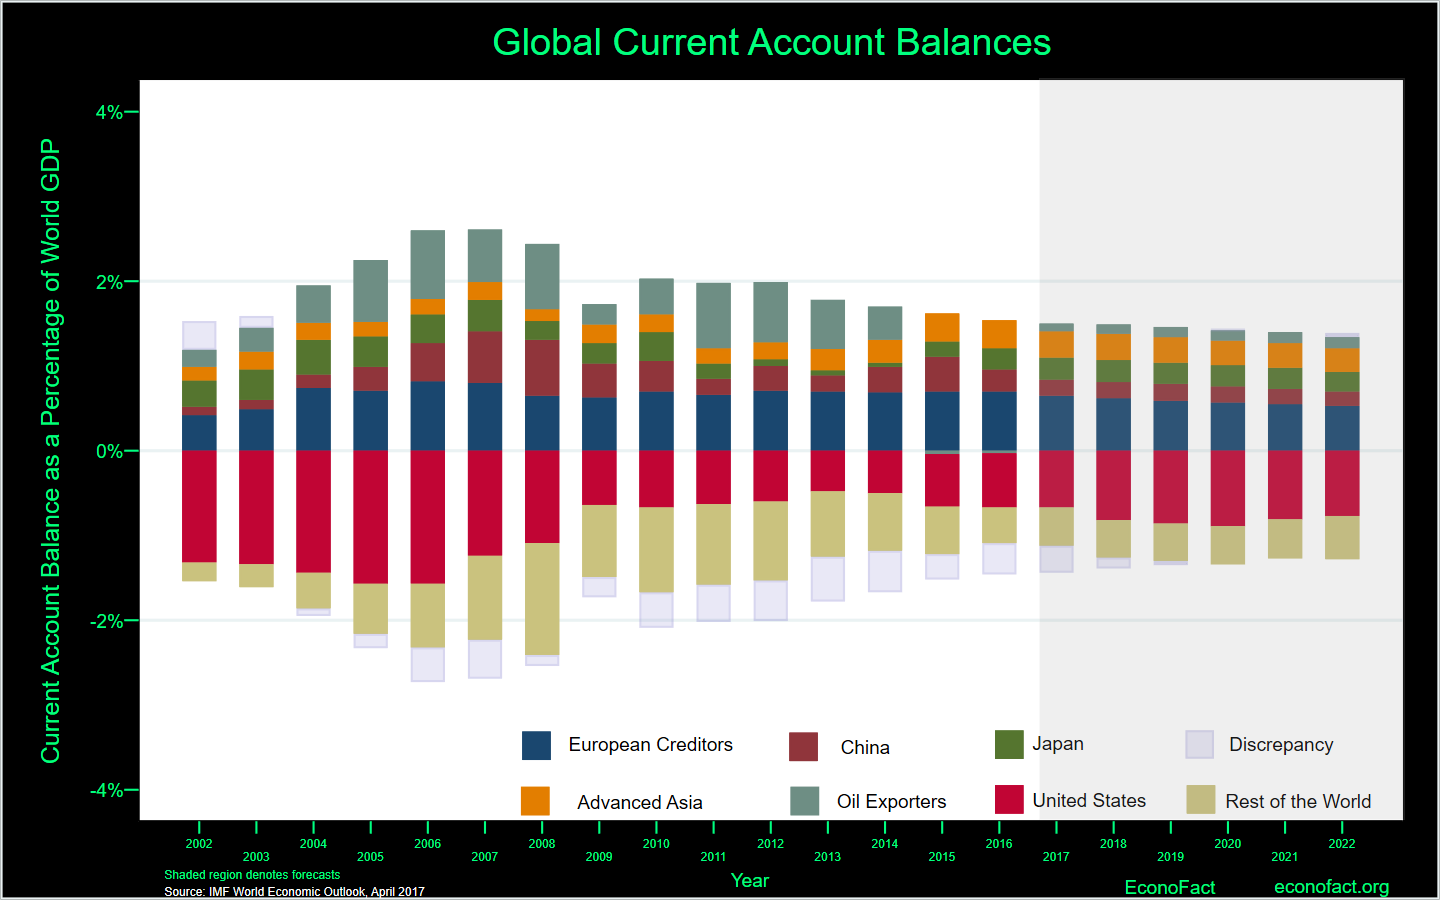
EconoFact: “Are Global Imbalances a Source of Concern?”
That’s the title of a new EconoFact piece. Here is the key depiction of some key current account balances, past and (possibly) future.
Mass Shooting Casualties in America as of October 2
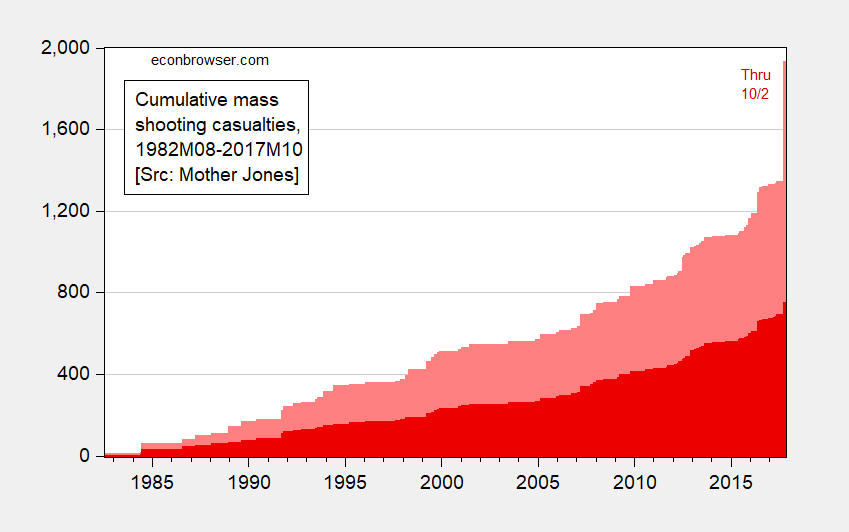
Figure 1: Cumulative sum of mass shooting casualties, beginning in 1982M08; deaths (red), wounded (pink). October observation for data through 10/2. Source: Mother Jones.
Return of the Tooth Fairies
(as referenced by Larry Summers, quoted in this post).
As I watched Secretary Mnuchin on Meet the Press (before discussing his taxpayer funded trip to view the recent eclipse) state :
…the president is not going to sign something that he believes is going to increase the deficit.
I was struck by an overwhelming sense of déjà vu. Of course, the caveat “he believes” is important. Mnuchin mentions “dynamic scoring”, but most economists agree that it is not plausible that the tax cuts as currently sketched out would lead to a revenue neutral outcome.
At Least Nero Fiddled

Source: The Hill.
The View from 2012: The Hiatus in Per Capita US GDP
If one was looking back at the data available a half a decade ago, an observer (not me) might have concluded that there was a hiatus in per capita output that signalled an end to growth.
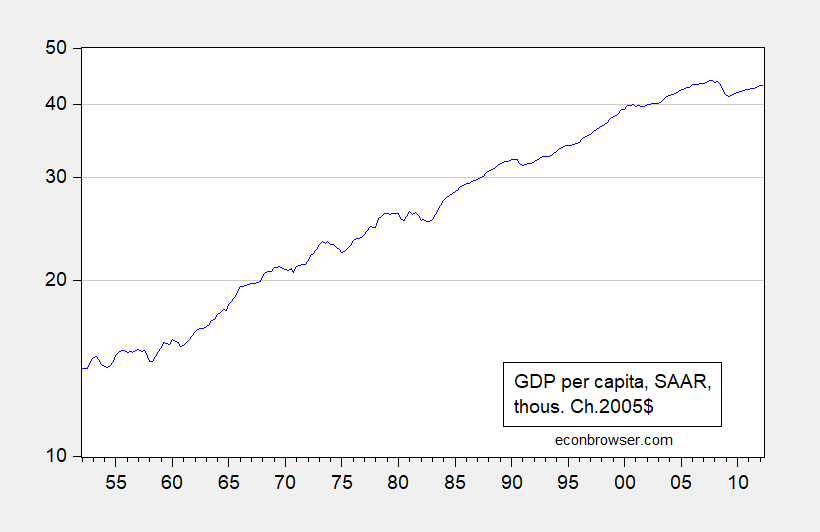
Figure 1: GDP per capita in thousands of Chained 2005$, SAAR, as of September 28, 2012, calculated using GDP and population reported at that date. On log scale. Source: St. Louis Fed ALFRED, and author’s calculations.