A reader brings my attention to John Schmid’s article documenting the Wisconsin employment slowdown, relying on the Census of Quarterly Employment and Wages, for the year ending December 2016.
Continue reading
Category Archives: Wisconsin
Minnesota Employment Growth Accelerates Relative to Wisconsin (Again)
Wisconsin and Minnesota released March employment figures today. Here, without comment (as none are needed) are year-on-year growth rates relative to the US average for Minnesota (blue) and Wisconsin (red).
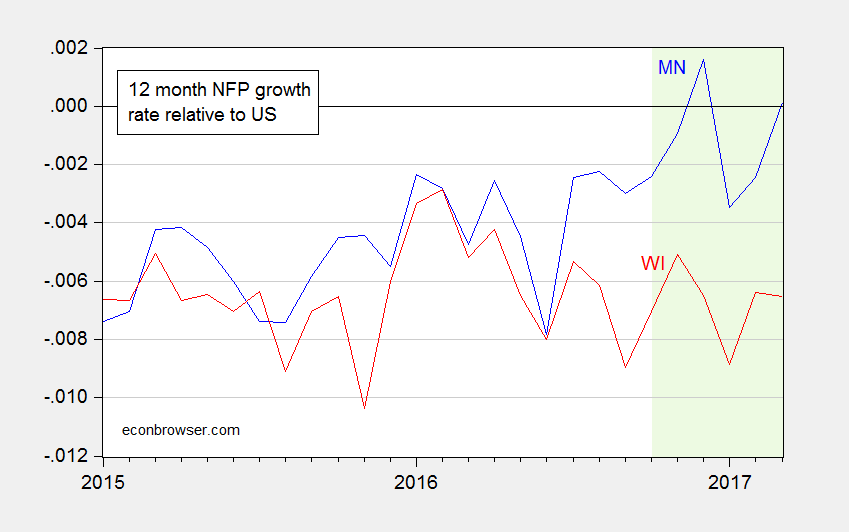
Figure 1: 12 month log-differences of nonfarm payroll employment for Minnesota (blue) and Wisconsin (red), relative to US. Green shading denotes sample not updated to reflect QCEW-related benchmarking. Source: WI DWD, MN DEED, BLS, and author’s calculations.
Wisconsin Benchmarked Employment through January: Flat since April
Today, the Wisconsin Department of Workforce Development released establishment data benchmarked to data from the Quarterly Census of Employment and Wages through September of 2016. Briefly, Wisconsin employment continues to lag the Nation, and its neighbor Minnesota.
December Employment in Wisconsin
Civilian employment and nonfarm payroll employment both decline.
“The Future’s So Bright, I Gotta Wear Shades”
That’s what Governor Walker said today about Wisconsin’s economy, quoting from a 1980’s song. This was apparently spurred by DWD’s release “Wisconsin Employment Reaches All-Time High in November”. This statement is true, when referring to the relatively imprecisely measured household survey figures [1]. It is not true when referring the (more precisely measured) establishment series.
Wisconsin GDP Trending Sideways
Quarterly state GDP figures for the second quarter were released yesterday. Estimated Wisconsin GDP is flat relative to 2015Q4; 2016Q1 GDP was revised down by 1.7%.
Wisconsin Growth Prospects
At least Kansas makes Wisconsin look good.
ALEC Rankings vs. Performance: Minnesota vs. Wisconsin Edition
In case you were wondering, Minnesota continues to outpace Wisconsin.
Wisconsin Nonfarm Payroll Employment Falls
Minnesota, US series continue to rise.
Wisconsin Employment in August
Wisconsin DWD release here.
Here’s private nonfarm payroll employment relative to 2011M01.
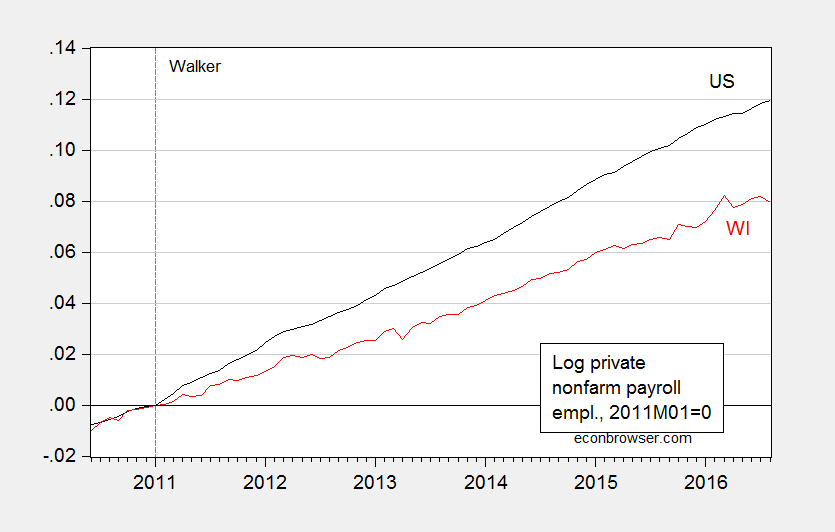
Figure 1: Log private nonfarm payroll employment for US (black) and WI (red), seasonally adjusted, both normalized to 2011M01=0. Source: BLS, DWD, and author’s calculations.