From CDC, Atlantic/Covid Tracking Project, and IHME:
Business Cycle Indicators, August 7th
With today’s employment situation release, here are five key indicators referenced by the NBER’s Business Cycle Dating Committee in Figure 1: Nonfarm payroll employment (blue), industrial production (red), personal income excluding transfers in Ch.2012$ (green), manufacturing and trade sales in Ch.2012$ (black), and monthly GDP in Ch.2012$ (pink), all log normalized to 2019M02=0.
The US-China Trade War/Soybean Front: Home before the (Next Batch of) Leaves Fall
On July 9, 2018, over two years ago, reader CoRev wrote:
Those of us arguing against the constant anti-tariff, anti-Trump dialogs have noted this will probably be a price blip lasting until US/Chinese negotiations end. We are on record saying the prices will be back approaching last year’s harvest season prices.
The GDP Collapse: It Is What It Is
Jim discussed elements of the 2020Q2 advance release on Thursday. Here, I amplify some aspects that he mentioned.
Business Cycle Indicators: August 3, 2020
Here are five key indicators referenced by the NBER’s Business Cycle Dating Committee in Figure 1: Nonfarm payroll employment (blue), industrial production (red), personal income excluding transfers in Ch.2012$ (green), manufacturing and trade sales in Ch.2012$ (black), and monthly GDP in Ch.2012$ (pink), all log normalized to 2019M02=0.
Guest Contribution: “The impact of the pandemic on developing countries”
Today, we present a guest post written by Jeffrey Frankel, Harpel Professor at Harvard’s Kennedy School of Government, and formerly a member of the White House Council of Economic Advisers. A shorter version appeared in Project Syndicate.
Record-breaking drop in GDP
The Bureau of Economic Analysis announced today that seasonally adjusted U.S. real GDP was 9.5% lower in the second quarter than it had been in the first quarter, which they reported as a decline at an annual rate of 32.9% (0.9054 – 1 = -0.329). That is four times as large a quarterly decline as anything since the BEA began reporting quarterly GDP in 1947, and represents a 10 sigma (10 standard deviations) event.
Continue reading
Guest Contribution: “Lasting Damage of the Pandemic”
Today we are pleased to present a guest contribution written by Ayhan Kose and Franziska Ohnsorge, respectively Director and Manager in the World Bank’s Prospects Group. The findings, interpretations, and conclusions expressed in this blog are entirely those of the authors. They do not necessarily represent the views of the World Bank, its Executive Directors, or the countries they represent.
Covid-19 Fatalities, Excess Fatalities, Forecasts
From CDC, Atlantic/Covid Tracking Project, and IHME:
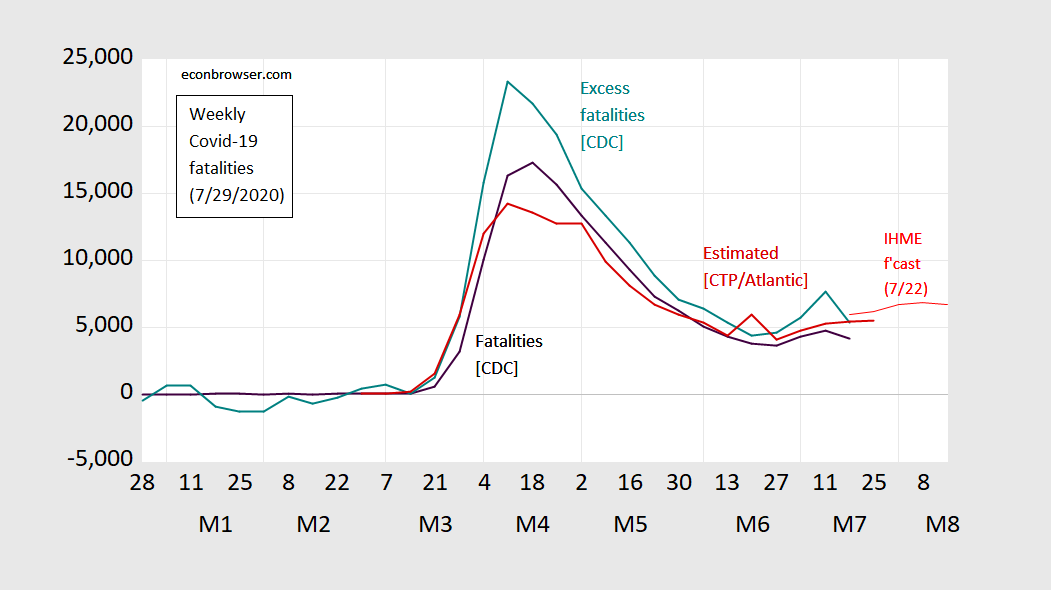
Figure 1: Weekly fatalities due to Covid-19 as reported to CDC for weeks ending on indicated dates (black), excess fatalities calculated as actual minus expected (teal), fatalities as tabulated by The Covid Tracking Project/Atlantic (dark red), IHME forecast (light red), all on log scale. Source: CDC 7/29/2020 vintage, Covid Tracking Project/Atlantic accessed 7/29/2020, IHME forecast of 7/22/2020, and author’s calculations.
Two observations: (1) the unofficial count is rising; (2) recent weeks’ (about a month’s worth) CDC data are subject to severe undercounting, so inferring recent trends on the basis of CDC data is not advisable.
From week ending February 29th through the week ending June 27th, the cumulative CDC fatality tally is 127.3 thousand. Cumulative excess fatalities is 164.8 thousand, implying an additional 37.5 thousand Covid-19 fatalities above the official tally over this period.
Covid-19 Fatalities per Million
See figure below: