- Population mean
- Sample mean
- Population standard deviation
- Sample standard deviation
- Standard error
- Administrative data
- Survey data
- Point estimate
- Confidence interval
- Sampling bias
- Reporting bias
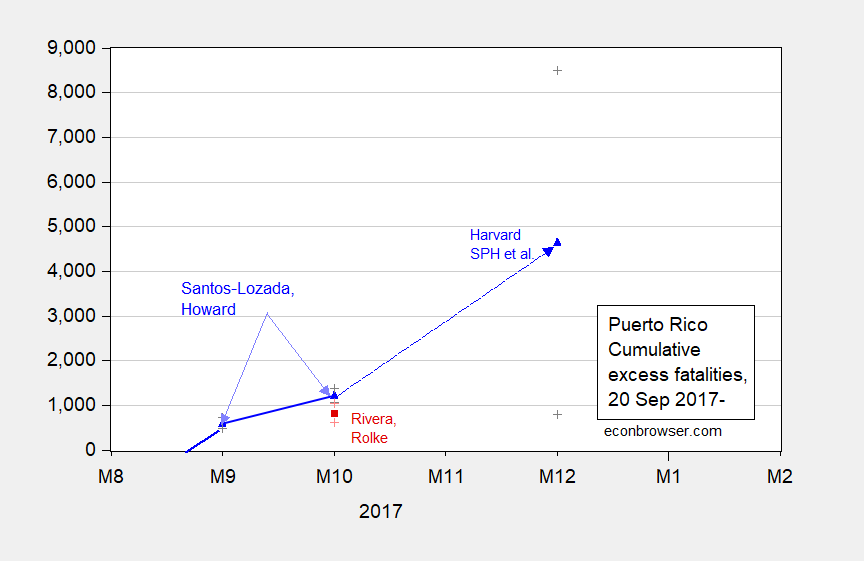
Now, let’s begin. Here is a graph of estimates of cumulative fatalities in Puerto Rico over time.
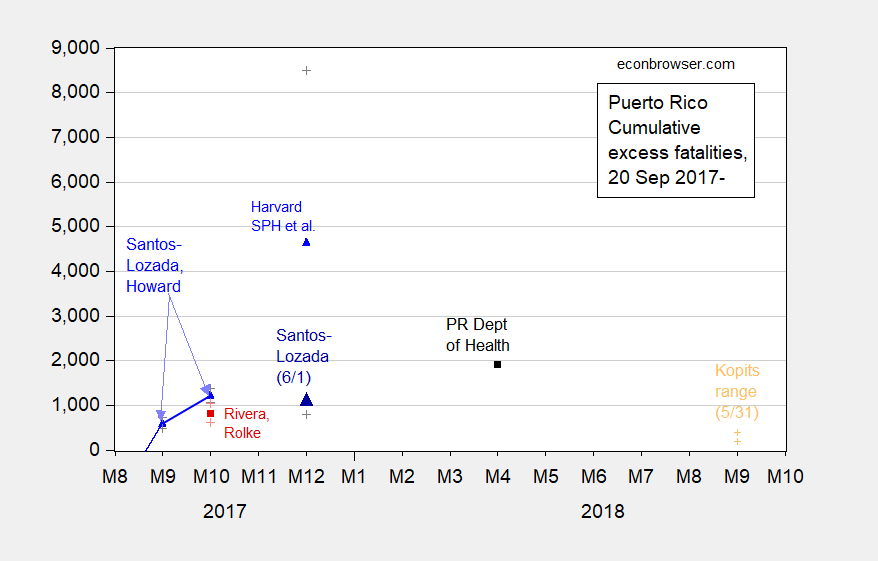
Figure 1: Estimates from Santos-Lozada and Jeffrey Howard (Nov. 2017) for September and October (calculated as difference of midpoint estimates), and Nashant Kishore et al. (May 2018) for December 2017 (blue triangles), and Roberto Rivera and Wolfgang Rolke (Feb. 2018) (red square), and calculated excess deaths using average deaths for 2015 and 2016 compared to 2017 and 2018 using administrative data released 6/1 (black square), and Santos-Lozada estimate based on administrative data released 6/1 (large dark blue triangle), end-of-month figures, all on log scale. + indicate upper and lower bounds for 95% confidence intervals. Orange + denotes Steven Kopits 5/31 estimate for range of excess deaths through September 2018. Cumulative figure for Santos-Lozada and Howard October figure author’s calculations based on reported monthly figures. [Figure revised 6/3]
Continue reading