Cumulative growth in Wisconsin since 2017M01 lags Illinois, according to estimates released today. And the 2018M09 Wisconsin index is below peak (nobody else in the region is).
Thankfully, “New Nafta” Has Saved Wisconsin Dairy!
Ooops. Jumped the gun. Actually Nafta 0.8 will only yield minor benefit to American dairy farmers. In the meanwhile, prices are plummeting…
Continue reading
Wisconsin and Her Neighbors
Bruce Hall takes issue with my post on Wisconsin’s employment growth, and writes (sarcastically):
Looks as if every state in the midwest is doing fine except Wisconsin.
Mebbe the unsarcastic interpretation is more correct. I let readers assess, based on these graphs.
Fragile Inferences on Minnesota Minimum Wage Effects
An informal assessment of the impact of the minimum wage change suggests a large negative impact. Appearances can be deceiving. From a forthcoming working paper by me and Louis Johnston, a graph of the log ratio of MN employment in limited service eating establishments to Wisconsin (blue, left scale), and log ratio MN/WI minimum wage (red, right scale).
Continue reading
US Treasury Yield Curve Website, Today…
Is it just me? I’ve tried 3 browsers and my iphone…
Continue reading
Corey Lewandowski: “Fed is … a rogue agency”
That’s from a remarkable op-ed in The Hill by Corey Lewandowski. He also writes:
Guest Contribution: “Modeling Time-Variation Over the Business Cycle (1960-2017): An International Perspective”
Today, we are pleased to present a guest contribution written by Enrique Martínez-García (Federal Reserve Bank of Dallas), based on his forthcoming article in Studies in Nonlinear Dynamics and Econometrics. The views expressed here are those solely of the author and do not reflect those of the Federal Reserve Bank of Dallas or the Federal Reserve System.
Guest Contribution: “China’s Q3 GDP Reportedly Slowed to 6.5%. Or Is It 6.4%?”
Today, we present a guest post written by Jeffrey Frankel, Harpel Professor at Harvard’s Kennedy School of Government, and formerly a member of the White House Council of Economic Advisers.
Q3 Chinese Growth
Private Nonfarm Payroll Employment Growth in US and Wisconsin (Not Pretty!)
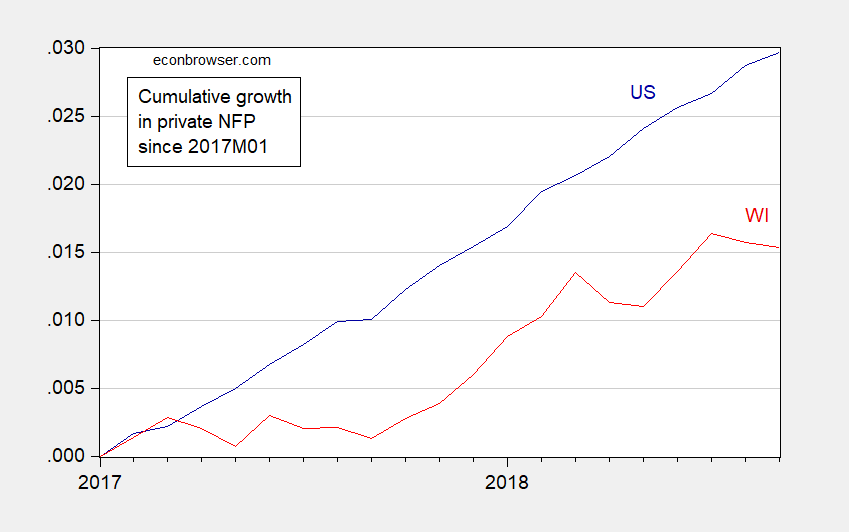
Figure 1: US private nonfarm payroll employment (dark blue), and Wisconsin (red), both in logs, normalized to 2017M01. Source: BLS, DWD, author’s calculations.