Source: Donald J. Trump, 6 December 2013.
Here’s some data: Global surface anomaly, year-to-date (June):
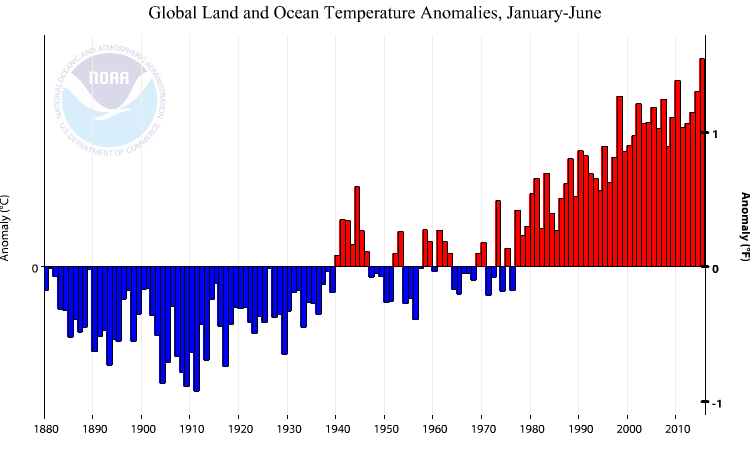
Source: NOAA
Source: Donald J. Trump, 6 December 2013.
Here’s some data: Global surface anomaly, year-to-date (June):
Source: NOAA
While Wisconsin lags, and statistically significantly so…
Has nonresidential fixed investment risen faster than GDP since the dot.com peak?
Following up on this post, estimating the consumption function
Reader Mike V castigates me for over-use of logs.
I’m not at all averse to logs, but they have a time an a place. You are trying to point out relatively small changes in income over a short time-series – not the nearly exponential changes in the S&P 500 over the last 100+ years.
Today we are fortunate to have a guest contribution written by Jeffrey Frankel, Harpel Professor of Capital Formation and Growth at Harvard University, and former Member of the Council of Economic Advisers, 1997-99.
Thursday’s GDP release incorporated an annual data revision extending back to 2012. In this recovery, output is 4% lower (in log terms) than the corresponding point in the previous recovery. In Ch.2009$, 2015Q2 output was 92.9 billion lower (at quarterly rates). The comparison (in log levels, normalized to troughs) is shown in Figure 1.
Today we are fortunate to have a guest contribution written by Carolina Osorio Buitron, Esteban Vesperoni, and Prakash Loungani, from the Research Department of the International Monetary Fund. The views expressed in this blog are solely those of the authors and do not necessarily represent the views of the IMF, its management, nor its Executive Board.
The Bureau of Economic Analysis announced today that U.S. real GDP grew at a 2.3% annual rate in the second quarter. You can’t describe the new data as favorable, but I’m still hopeful about what comes next.
Continue reading
No surprise, Minnesota beats Wisconsin, again.