The undershoot in nonfarm payroll employment is noticeable, with a flattening in high contact services employment growth.
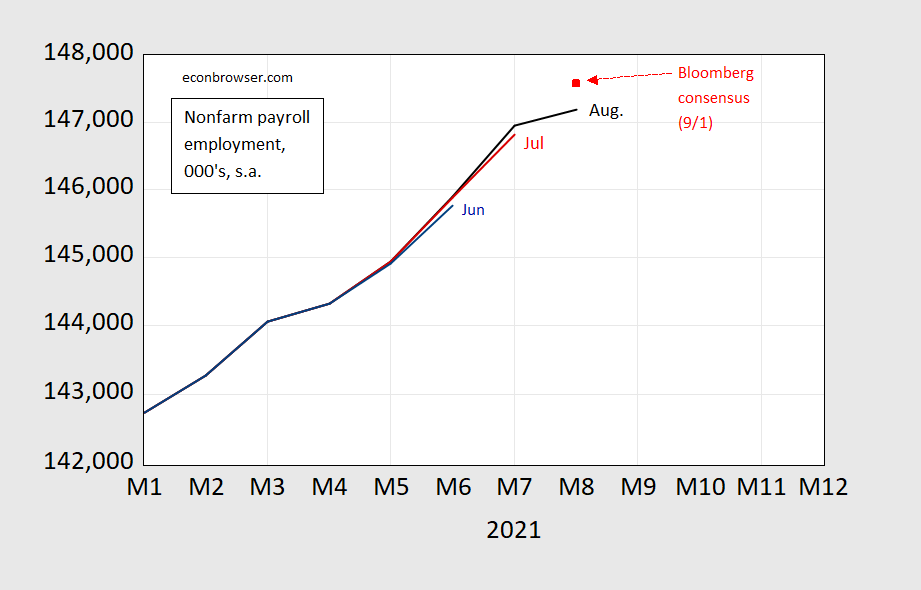
Figure 1: Nonfarm payroll employment from June release (blue), July release (red), and August release (black), and August Bloomberg consensus implied level (red square). Source: BLS, Bloomberg (9/2), author’s calculations.
The Bloomberg consensus was consistent with constant growth rate; the miss was over 500K.
Employment from the household survey rose faster (twice as fast in August), but not enough to change the picture dramatically.
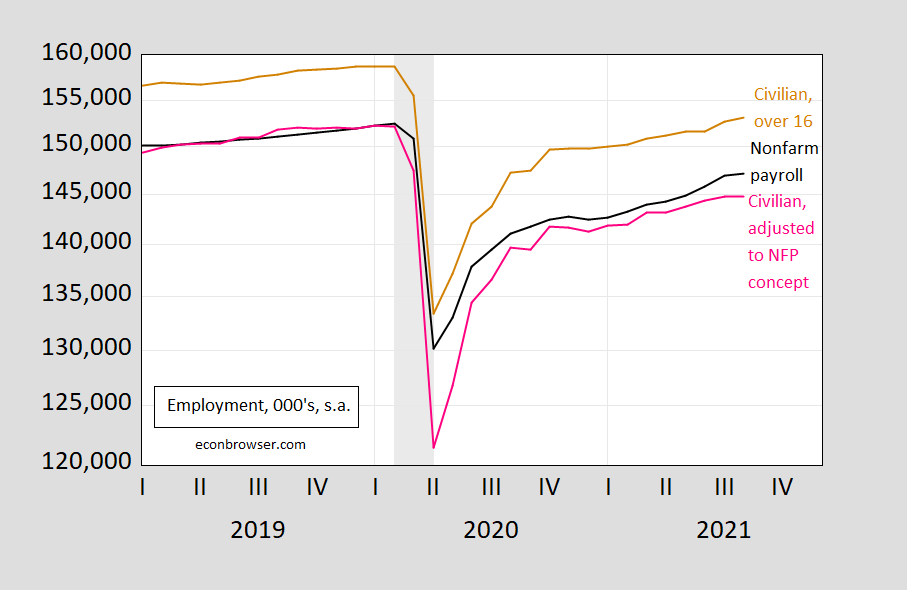
Figure 2: Nonfarm payroll employment (black), civilian employment over 16 (brown), and civilian employment adjusted to the NFP concept (pink). NBER defined recession dates shaded gray. Source: BLS, NBER.
Over the past year, civilian employment and nonfarm payroll employment growth as been about the same (3.9% vs. 4.2%). Civilian employment redefined to NFP concept is a bit slower, at 3.6%.
Figure 3 highlights the fact that goods production employment (specifically manufacturing) continues to grow, while accommodation and food services employment growth declines slightly (the broader category of leisure and hospitality is flat).
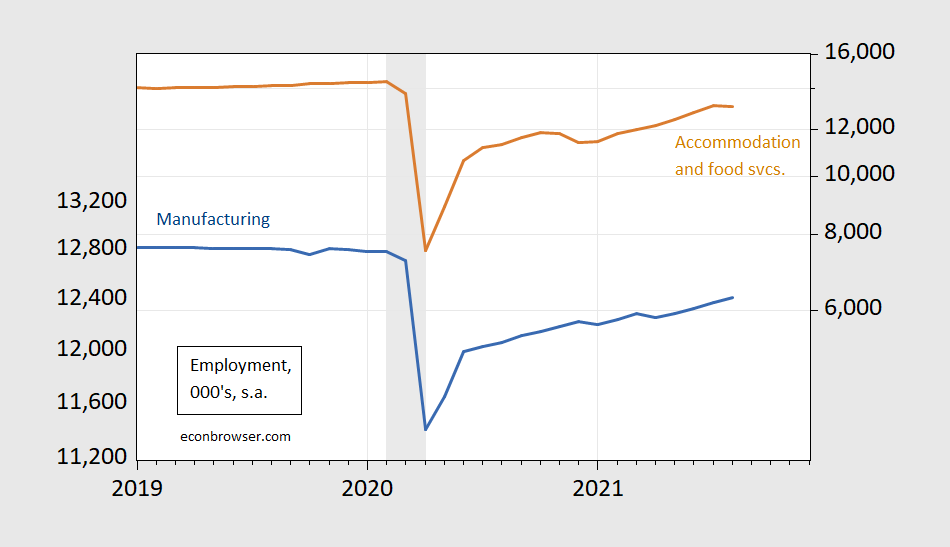
Figure 3: Employment in manufacturing (blue, left log scale), in accommodation and food services (brown, right log scale). NBER defined recession dates shaded gray. Source: BLS, NBER.
Had employment in accommodation and food services risen the same amount in August as it did in July (363K), and all other categories grew as they did, then nonfarm payroll employment would have grown by nearly 400K more (i.e., 635K vs. 435K actual).
Torsten Slok observes (note, 9/3):
…The delta variant held back hiring in Leisure and hospitality in August, but employment moved up in Warehousing and storage and Couriers and messengers. Overall, employment in Couriers and messengers is 17% higher than its pre-pandemic level. The bottom line is that covid held back hiring in August. With the expected peak in delta, we should begin to see jobs growth pick up again over the coming months.
The CDC forecast of 8/30 (posted 9/1), below:
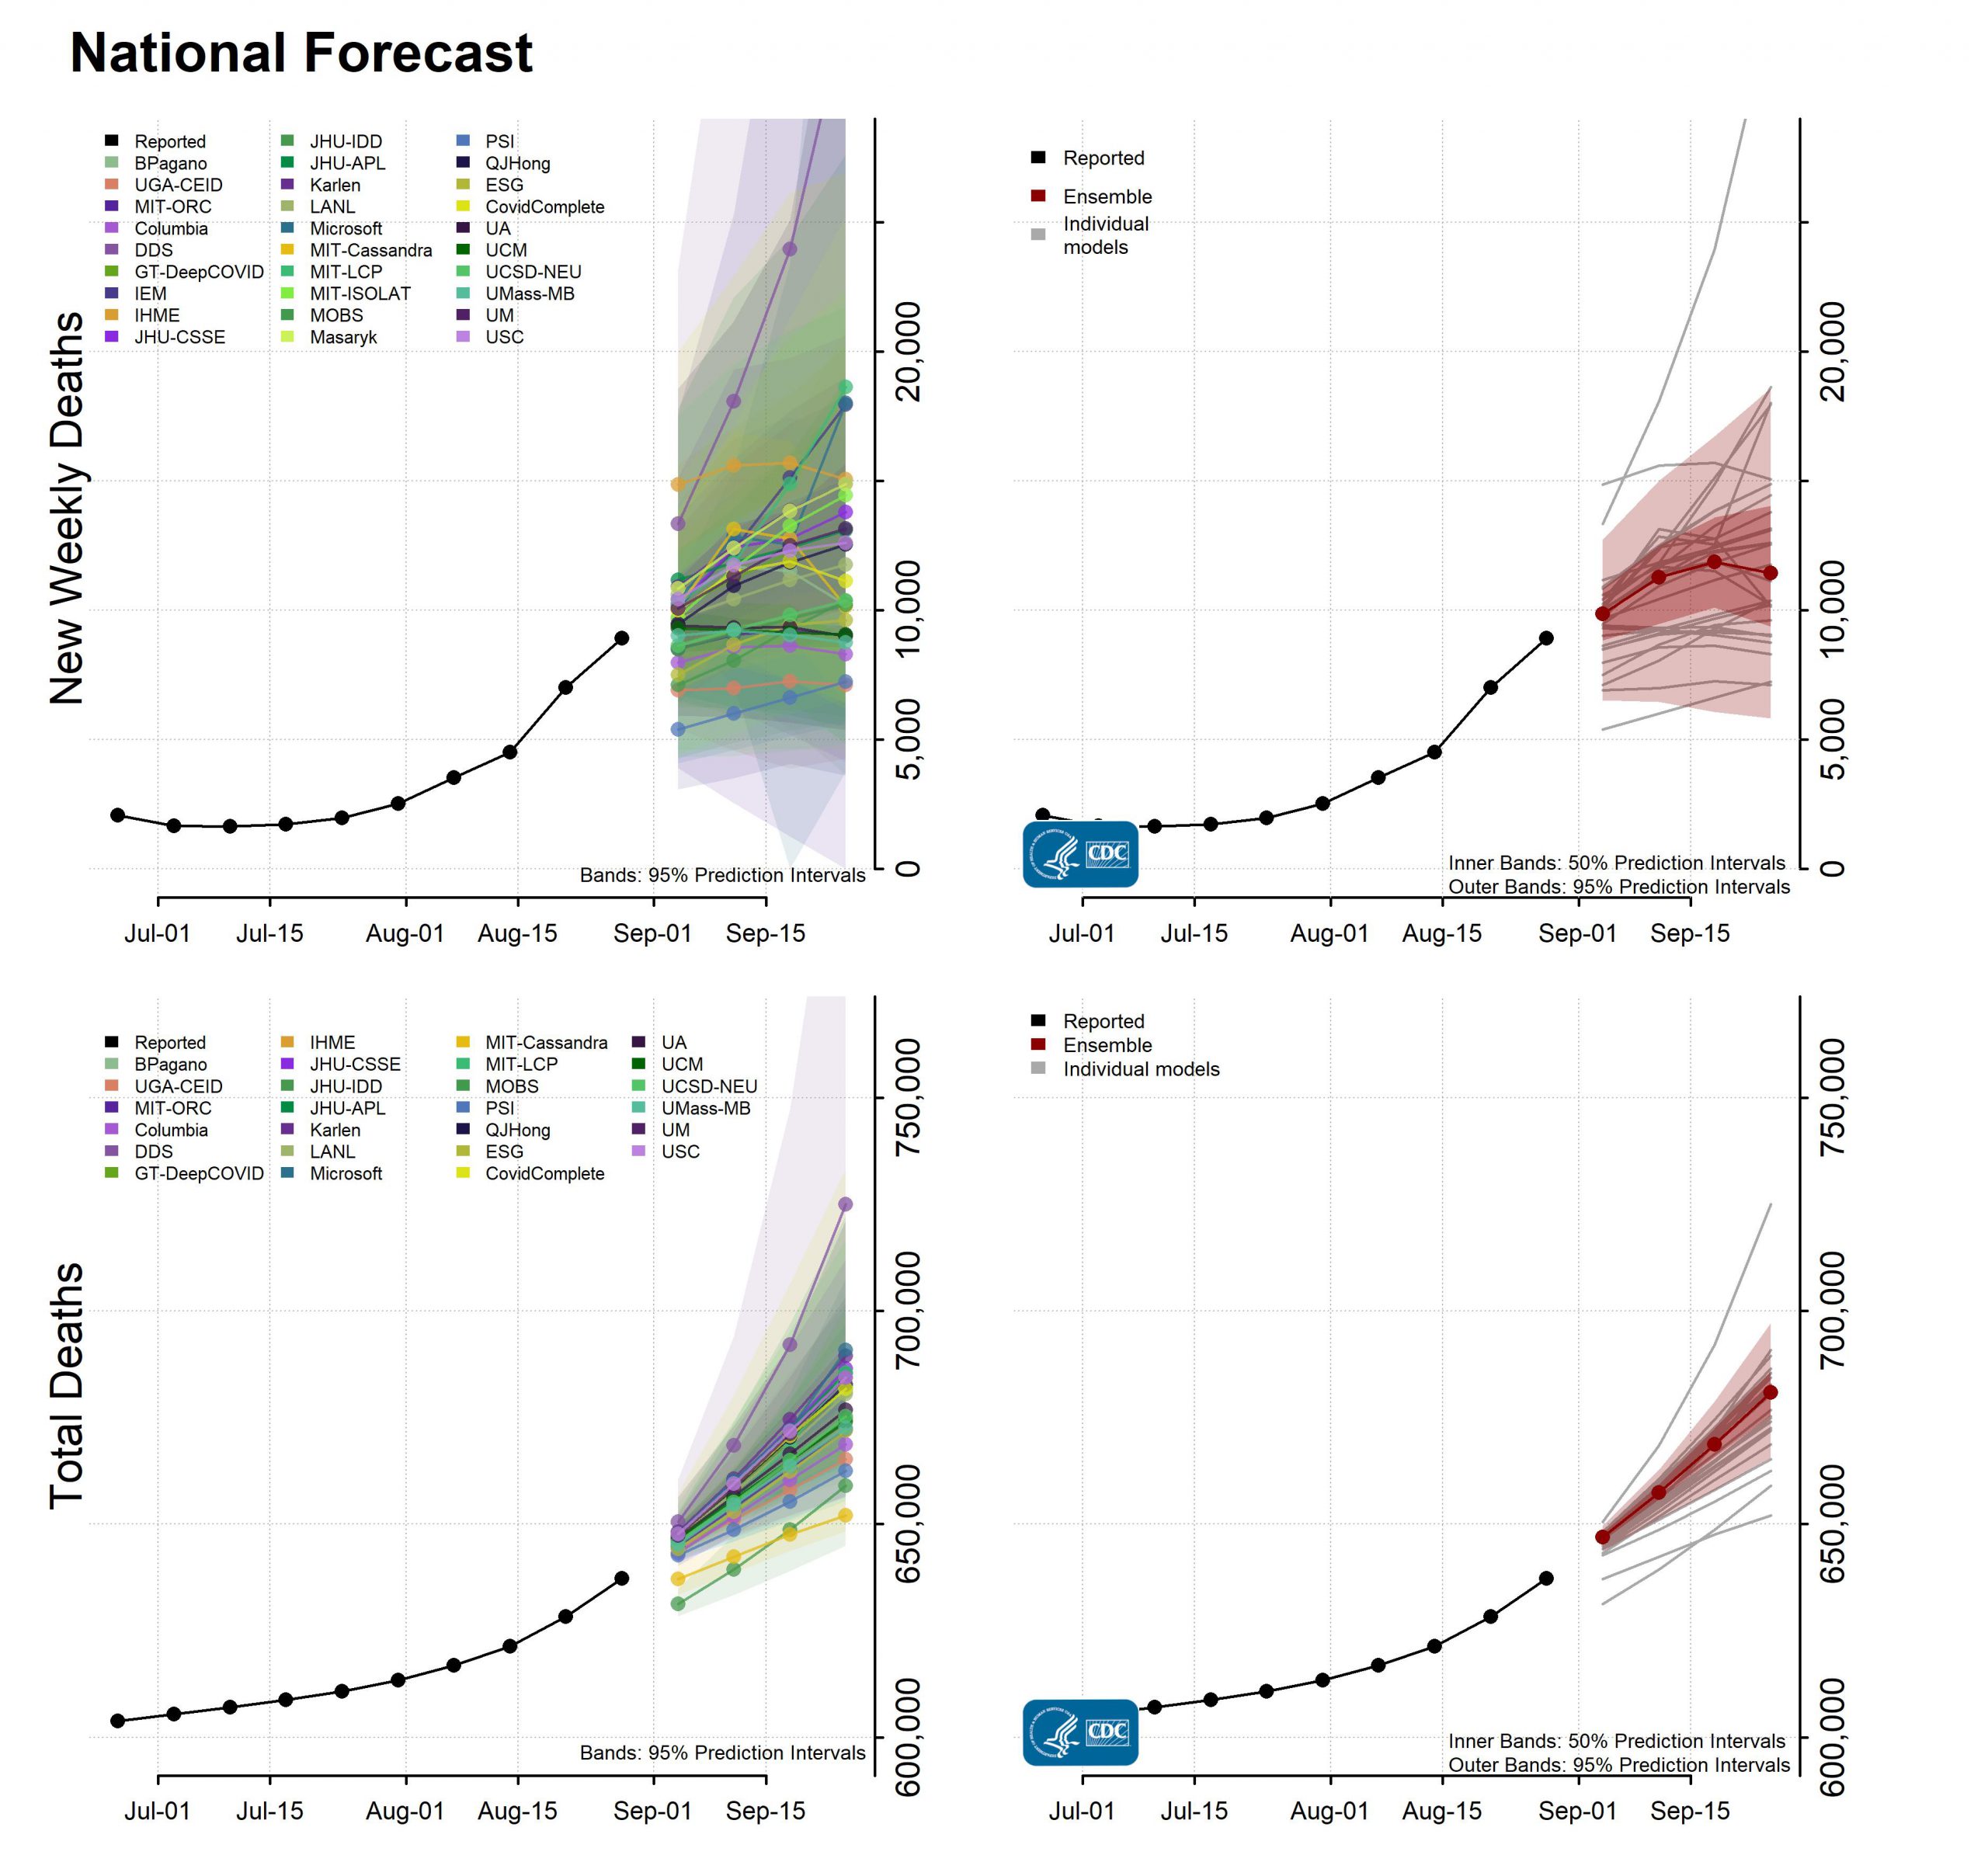
Source: CDC, accessed 9/6.
The CDC ensemble model places peak deaths at about 2 weeks from now (3 weeks from 8/30). The question in my mind is whether the individual models underlying the CDC ensemble model incorporate the effects of Labor Day travel and the opening of schools — both K-12 and college/university.
The dualistic nature of the recovery also shows up in wage data.
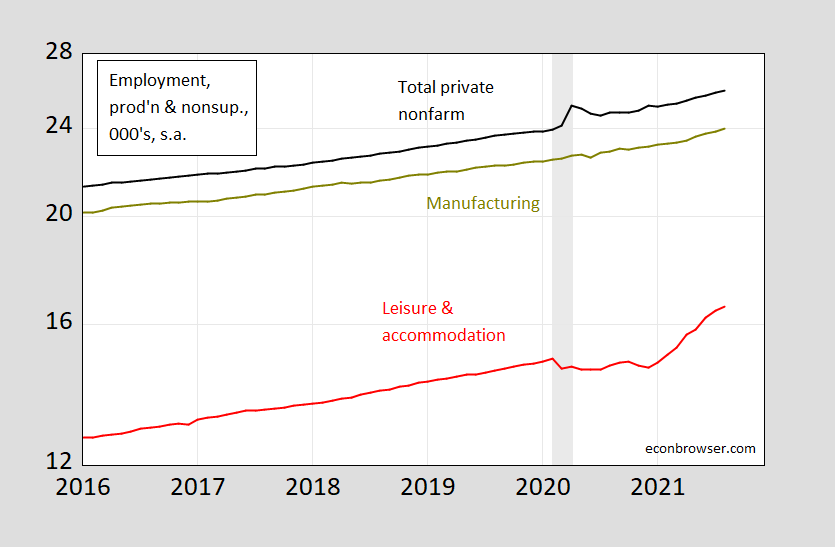
Figure 4: Average hourly earnings in total private earnings (black), in manufacturing (chartreuse), and in leisure and hospitality services (red), $/hour for production and nonsupervisory workers. Source: BLS.
Wage growth has accelerated (as shown by the steepening slope) in the aggregate and in manufacturing. However, wage growth in leisure and accommodation only accelerated as vaccination began — and has continued until exceeding the pre-pandemic trend (5% in log terms). The lack of clear evidence that enhanced benefits have driven a reduction in labor supply means that it’s possible the rising wages are due to other factors depressing supply (fears of exposure to Covid-19, other compensating differentials, or child or parental care constraints, etc.).
Menzie – somewhat related… any thoughts on NY Fed suspending their nowcast of gdp? Given their reasoning, I wonder why now? Why not months ago? I wonder if others will follow suit (e.g. 6th district).
A comparison of regional Fed bank nowcast: https://econbrowser.com/archives/2020/10/nowcasts-compared
It may be that methodological choices make the NY Fed’s approach more problematic than the St. Louis or Atlanta Fed’s.
Either way, the latest auto sales and international trade data put a big dent in the Atlanta nowcast: https://www.atlantafed.org/cqer/research/gdpnow?panel=1
Problem with that is the distortion in auto sales. Add in used cars. Their model is busted as well.
As noted in an earlier comment, the drop in food service and accommodation jobs looks Covid-driven, real and painful. The second largest swing, in local government education jobs, is just a timing issue. Take 100k teachers from July’s record rise, add that 100k to August, for a more realistic view of hiring.
If we weren’t trying to regain lost jobs, 335k (after my little adjustment) would be a great single-month job gain.
The end of federal enhancement for jobless benefits amounts to something like $8 billion per week. Most of that was being spent. We’ll see a drag on spending. The peak in Delta infections (knock on wood) accompanies a shift northward. We could see more Covid-driven job losses in the September report, especially as the data will reflect only be first half of the month.
This article is dated in many aspects because it’s from last December. But it’s from one of my favorite journalists, Eduardo Porter. And if you look at the more general information as it relates to the effects of cutting government benefits on spending, it’s a very good read, along with the associated academic papers,
https://www.nytimes.com/2020/12/14/business/economy/unemployment-benefits-economy.html
From the December 2020 (backdate the months, such as August accordingly) NYT Eduardo Porter authored article:
By the end of August, however, the last month in which the researchers tracked the finances of the unemployed, their median bank balances had shrunk by about a third since July, losing most of the cushion built up since March.
“The typical family does still have somewhat of a cash buffer,” said Fiona Greig, co-president of the JPMorgan Chase Institute, “but it is declining precipitously.”
Regular unemployment insurance in the United States remains among the least generous in the Organization for Economic Cooperation and Development, typically falling to zero after six months, barring extraordinary legislation. In Denmark or Portugal, by contrast, unemployment benefits replace around 80 percent of the lost wages of workers even two years after they lose their jobs.
In the United States, jobless benefits add up to about 20 percent of the median income for a family with two children, according to data from the O.E.C.D. In Germany and Ireland, they amount to over 50 percent.
Is there a problem with seasonal adjustment since 2008?
Apparently David Autor has a piece over at the NYTimes, which alas I do not pay for. Kevin Drum noted his discussion but again alas said very little about what Autor wrote. Anyone who decides to get us past the NYTimes firewall so we can see what Autor said would be much appreciated.
“First, that the labor shortage is caused by government benefits that discourage work. And second, that the shortage will harm the economy.”
“Both claims are wrong. With the latter, the opposite is likely to be true: The labor scarcity we’re experiencing is real. But this is an opportunity, not a crisis”
His suggestion is that demographics and immigration trends will keep us in a long-term state of labor shortage. His argument is basically that we will all be better off if the lower end is lifted substantially. Robots taking over certain jobs is also good, as long as it doesn’t kill the labor shortage. A little weaker is the argument that the extra quarter paid for a burger would be saved by lower taxes (because we no longer would subsidize businesses with social services and EIC payments to their employees). But certainly those at the low end of the pay scale would be able to pay a little more if they earned more. Personally I think the above median income groups can afford to share better with the rest, by paying a little more for services/products delivered by low pay employees.
https://fred.stlouisfed.org/graph/?g=sxNb
January 4, 2018
Employment-Population Ratios for White, Black and Hispanic, * 2017-2021
* Employment age 16 and over
https://fred.stlouisfed.org/graph/?g=sxNk
January 4, 2018
Employment-Population Ratios for White, Black and Hispanic, * 2017-2021
* Employment age 16 and over
(Indexed to 2017)
https://fred.stlouisfed.org/graph/?g=sxz6
January 4, 2018
Employment-Population Ratios, * 2017-2021
* Bachelor’s Degree and Higher, Some College or Associate Degree, High School Graduates, No College; Employment age 25 and over
https://fred.stlouisfed.org/graph/?g=sxzm
January 4, 2018
Employment-Population Ratios, * 2017-2021
* Bachelor’s Degree and Higher, Some College or Associate Degree, High School Graduates, No College; Employment age 25 and over
(Indexed to 2017)
I don’t see all the optimism about Covid peaking in the U.S. The UK, Canada and Israel all have much higher vaccination rates than the U.S. and still have rising case rates, not to speak of death rates which trail cases by two or three weeks.
Vaccination rates in the U.S. are the embarrassment of the world. The world’s richest nation, the one that was first to seize most of the world’s vaccine production to themselves, is falling farther and farther behind the rest of the world. It seems that what the “peaking optimists” are clinging to is the possibility is that the U.S. will simply allow the delta variant to infect the entirety of the unvaccinated population to achieve natural immunity.
The 7-day average peak at in new cases in January was just over 250,000. The latest average is around 150,000, with just over half of us vaccinated. So while the Delta variant is doing a pretty good job infecting anyone available to infect, it’s easy to see why models would anticipate a peak soon.
https://covid.cdc.gov/covid-data-tracker/#trends_dailycases
If Delta has fewer potential victims to work with and vaccination and previous infection served as a sort of firebreak against rapid spread, we’d be seeing a lower peak in new infections. Simple math says this peak should be less than half the prior peak. Simple math is far wrong.
At a guess, the ability for those who are vaccinated to transmit Delta without becoming ill means no firebreak. Herd immunity doesn’t work very well on Delta.
@ joseph
PhD economists have a technical term they use for this optimism. But because of its complexity it hasn’t seeped out to broader usage outside of the ivory towers. It’s called “wishful thinking”. I predict this scientific or economists’ “shoptalk” term will catch on eventually in much the same way Harrisonburg VA mathematical economists use the term “skewed distribution” to describe near to uniform distribution of Native American ancestry in European (“white”) Americans. For example if you look at page 6 of this data set using shades between white a “brunswick green”, the variation is utterly astounding. Obviously “skewed”.
https://www.ncbi.nlm.nih.gov/pmc/articles/PMC4289685/bin/mmc1.pdf
joseph,
I am not sure how long you have been around here or how closely you have paid attention, but this claim by Moses Herzog that the distribution of Native American Indian genes among the European-descended population of the US is “near to unifotm” is not only screamingly and pretty obviously false, he has kept repeating this nonsense despite its having been pointed out to him repeatedly that it is false and without him getting a single person to go along with this foolishness. The arguments on this have been discussed way too many times here already, but if you have not seen them or are not able to figure out that Whites in Oklahoma tend to have much higher proportions of native American ancestry than ones in European neighborhoods in Brooklyn containing peope who mostly just immigrated or ate the children or immigrants, well, I can provide more. But almost everybody here has seen this one-sided debate way too many times, although for reasons unclear Moses keeps thinking somehow he can make this ignorant and foolish statements and somehow look like being something other than utterly ignorant and foolish.
Moses,
The table that shows percentages of Native American ancestry in European Americans by state is S7. This is clearly not remotely uniform across states. just how stupid are you that you provide a link that utter disproves the stupid claim you have made over and over and over here that has been repeatedly debunked. In this case, you have provided the debunking yourself, although apparently you are either too stupid or too drunk to figure it out.
Again, Table S7 is it, and you are wildly wrong.
certainly does not seem to be an even distribution. seems to me, the green appears to exist where we have higher concentration of native american lands today.
baffling,
Yes, since Moses is now on another thread claiming I have lost brain cells due to age, I am wondering what he caused him to lose brain cells (or maybe he never had them) that he would so incredibly stupidly post a link that completely disproves his claim about skewed distributions, a claim that has been refuted many times without a single person here buying it, but somehow he thinks this is a winning argument for him, evidence of me losing brain cells. So I shall hammer this down a bit more.
Yes indeed, not only does crucial Table S7 not show an even distribution but it suggests exactly what I said, a skewed distribution. That can be seen by seeing a small number of states way ahead of the others, notably North Dakota, Louisiana, New Mexico, and Idaho. That is the mark of a skewed distribution. Moses’s link in fact provides evidence not only against his silly claim of an even distribution, but of a likely skewed distribution, which it is widely known is the case.
I shall also, hoping we really do not see him putting for this idiotic garbage again, remind or perhaps inform some for the first time, what got Moses going on this nonsense. It was part of an earlier hate campaign by him against yet another older powerful woman, Elizabeth Warren, although he has since let up on her, perhaps because she apologized publicly for some things he was really roasting her for, namely her excessively playing up her skimpy Native American ancestry back in the 1980s. Tramp challenged her to take a DNA test, which she did, and which in fact showed she had about the amount of Native American ancestry she had claimed she had, which was very little.
But this set Moses off because he found a stat that said that the average (mean) amount of Native American ancestry in Euro-Americans is higher than what she has, which then led him inaccuratly to claim that “the average Euro-American has more Native ancestry than does Warren. I then ponited out (accurately) that this distribution is skewed, which means that the mean is not the same as the median, with the latter the better measure of what an “average Euro-American” has. The skew is indeed due to small sub-samples, like those folks in ND, LA, ID, and NM having way much higher percentages than the vast majority of the Euro-American population has, with in fact that median Euro-American having zero such ancestry. But Moses was not having any of this, wanting to smear Warren so badly, not to mention somehow prove that I am a doo doo head who is losing his marbles. So he began this relentless campaign to assert without a shred of evidence that the distribution of Native American ancestry actross Euro-American is actually even, which is rankly absurd and ridiculous. And he has kept at it over and over despite having had it shown he is full of it on this over and over. And here he is doing it again, somehow thinking that making an apparently insulting remark about me in connection with “skewed distributions” somehow convincing anybody here that I am losing my marbles while he is a brilliant population geneticist, all of this nonsense initially motivated by his desire to smear by repeating pathettic GOP propaganda an older powerful progressive woman.
The whole business has been not only massively ignorant and stupid, it was shameful from its origins.
Since Moses did everybody the favor of linking to an article clearly disproving all the incorrect claims he has been repeatedly blasting away here about the distribution of Native American ancestry, I might as well really nail the coffin shut on this by noting two other items connected to this that Moses has also gone on and on about in a ridiculous manner.
So, although he has not done it recently since Menzie dumped on him for it, he was for quite a long time ridiculing me as someone who supposedly is constantly reading and relying on Quora as a great source. This has actually been simply another of his outright lies as I have in fact never gone to the Quora site to see what they post. I linked once to an article that appeared there because it popped up on a google search, but that was it. But somehow Moses thinks this Quora site, which I frankly still really know almost nothing about, is just totally awful and unreliable, although Menzie called him out on that, questioning this frequently repeated claim by him.
So he denounced Quora because of that one article I cited. Yeah, it was about this Native American genetic distribution question and I linked to it as support for the completely accurate arguments I was making that I have laid out in comments above, this matter of the distribution of such ancestry being skewed across the Euro-American population, undercutting his nasty attempted smear of Elizabeth Warren. So he questioned this source, although it was by a recognized population geneticist, because it appeared in the supposedly awful and unreliable Quora, which, again, for the record, I have never accessed or looked at beyond this one linkage.
But then, contradicting himself on the supposed unreliability of Quora and unbelievability of this article, he took to quoting it, also repeatedly since despite having been ridiculed for doing so. He found in the article a claim that there was an even distribution of the character across the gene. He then somehow decided this implied an even distribution across the population. When he first attempted to ridiculue me using this quote, several people jumped oh him for being utterly stupid, which he was. But in fact this would become probably his most frequently brought-up point in connection with this whole matter, repeatedly declaring that I am an idiot because somehow I have ignored this point made in that article, which he dissed, that the characteristic is evenly distributed across the gene. I shall simply note that I have lost count of the number of times I have noted that a gene is not a population, and indeed, he has conveniently provided us with this link where on Table S7 one can clearly see that Native American anceatry is not remotely evenly distributed across the Euro-American population, indeed, looks to be distributed in a skewed way as I argued from the beginning accurately.
And now I really hope we shall never again see any of these seriously moronic references by him to “skewed distributions” or “even distribution across the gene” or “Quora is a no good source” or “Elizabeth Warren has less Native American ancestry than the average US white person.” But knowing him, I suspect that there will indeed be some occasion again, probably when he pretty seriously plastered, when he will somehow think he is really dinging me by again dropping one of these references that only remind people of how stupid and ignorant he has shown himself to be regarding this entire matter.
as ron white said, you can’t fix stupid.
https://fred.stlouisfed.org/graph/?g=sxWm
January 4, 2018
United States Employment-Population Ratios for Men and Women, * 2017-2021
* Employment age 25-54
https://fred.stlouisfed.org/graph/?g=wEsi
January 4, 2018
United States Employment-Population Ratios for Men and Women, * 2017-2021
* Employment age 25-54
(Indexed to 2017)
Certainly seems as though cutting off extra unemployment benefits has not spurred on rising employment. Maybe some folks should reconsider that covid and dependent care effects are impactful in keeping workers on the sidelines.
Texas is getting smothered right now with runaway covid infections at schools and daycares, due to the governor eliminating mask and vaccine mandates. Its going to be a rough and frustrating fall for texas.
ruining economies is a feature of the panic response not the virus.
virus does not discriminate against the vaccinated, equal likely a vaccinated achieves a +pcr!
zero covid until the end of the world !
another silly comment, doesn’t make any sense.
“ruining economies is a feature of the panic response not the virus.”
please explain how wearing a mask and getting a vaccine ruins an economy.
Children now pleading with adults to show some consideration for their fellow man:
https://kfor.com/news/local/its-literally-life-or-death-oklahoma-special-needs-community-pleads-for-public-to-help-protect-their-kids-by-wearing-mask-getting-vaccinated/
You wouldn’t think that “conservative” Republicans who claim to care abut “family values” would just be indifferent about children dying. Republicans’ carelessness in spreading the respiratory virus which then makes hospitals unable to give the capacity patients need, in life or death scenarios for children, is now called “freedom”.
would you expect anything else from a party that now justifies the banning of abortion with the argument that it will now prosecute rapists.
Makes one wonder what they’ve been doing till now.
And if “Grendel’s Den” nullifies the Texas abortion ban, then “Oh, never mind” when it comes to rape?
I heard that. It would be nice if Texas found a way to eliminate all rape especially given the fact that Texas had the highest number of reported rapes in 2019. Look – rape is a serious problem in New York but our reported rapes were less than half of those in Texas.
Does that New York number include or exclude state Governors??
https://ag.ny.gov/sites/default/files/2021.08.03_nyag_-_investigative_report.pdf
https://www.theguardian.com/us-news/2021/aug/03/andrew-cuomo-new-york-governor-sexual-harassment-investigation
Oh, did Abbott actually mention that he would “prosecute” rapists? What I saw indicated only that he mentioned that he would “eliminate” rape. He and the Texas QOP could accomplish that simply by changing the criminal code so that what they now define as a crime is no longer a crime. No rape means no conceptions due to rape.
Sounds both cynical and horrible, I know, but when I think about what they’ve already done, such a possibility no longer seems so … implausible.
I hate that the last 5 years have turned me into someone who could think that.
Texas had 15,000 rapes in 2019. Abbot appears to want to bring all of those to term. He is an idiot.
moses, i have noticed the compassionate conservative is quite concerned about precious life in the womb. they just don’t seem to care that much about life after birth. why else would they be so against food stamps for a child.
https://www.nytimes.com/2021/09/04/opinion/labor-shortage-biden-covid.html
September 4, 2021
The Labor Shortage Is Empowering Workers to Demand Better Jobs
By David Autor
Many employers are alarmed about the current labor shortage — the phenomenon of a labor market with more job openings than unemployed workers. There are two supposed problems, they allege. First, that the labor shortage is caused by government benefits that discourage work. And second, that the shortage will harm the economy.
Both claims are wrong. With the latter, the opposite is likely to be true: The labor scarcity we’re experiencing is real. But this is an opportunity, not a crisis.
Let’s start with the causes of the current labor shortage. Research on this question is unambiguous: We don’t know what’s going on. One logical explanation is that generous pandemic unemployment insurance benefits are now giving them reason not to work. But the data don’t bear this out. Multiple analyses find that generous benefits did discourage workers from seeking new jobs. But the effects were small. States that terminated federal pandemic unemployment benefits ahead of schedule this summer saw only a minuscule decline in unemployment relative to those that didn’t. Tellingly, continental Europe and Britain are experiencing labor shortages similar to those in America, even though they barely expanded unemployment benefits during the pandemic. (Instead, they covered the paychecks of workers whose hours were cut or who were furloughed.)
A second culprit is child care. When schools, day care centers and summer camps closed, parents — moms, mostly — became full-time caregivers, making a return to the workplace all but impossible. Women with children have since returned to work at almost the same rate as women without children, meaning access to child care isn’t the main culprit.
Let’s entertain a third possibility. People’s valuation of their own time has changed: Americans are less eager to do low-paid, often dead-end service and hospitality work, deciding instead that more time on family, education and leisure makes for a higher standard of living, even if it means less consumption.
If the lack of enthusiasm for bad jobs lasts, does this bode ill for the U.S. economy? The answer is no — and here’s why: The U.S. doesn’t have a job quantity problem; instead, it has a job quality problem.
For the past 40 years, our economy has generated vast numbers of low-paid, economically insecure jobs with few prospects for career advancement. On almost every measure — pay, working environment, prior notice of job termination, and access to paid vacation, sick time and family leave — non-college-educated U.S. workers fare worse than comparable workers in other wealthy industrialized nations. Consider this: Low-education workers in Canada make one-third more per hour than their U.S. counterparts. Of course, America’s job-quality problem is longstanding. So what does it have to do with the pandemic? …
David Autor is a professor at the M.I.T. Department of Economics.
Thanks for this very useful discussion from David Autor.
Now Kevin Drum managed to read only one thing from this:
“Let’s start with the causes of the current labor shortage. Research on this question is unambiguous: We don’t know what’s going on.”
Look I generally enjoy reading Kevin Drum’s blog post but this stupid summary was a disgrace – if not an insult to what Autor had to offer.
Drum is probably not going to copy/paste the entire column. Not to mention it’s not terribly surprising a guy working at MIT with his PhD and focusing in labor economics would write something a little better on that topic than a journalist.
I like to make friendly jokes about those Puh-hud weirdos, but come on, let’s not get out of control here.
Yeah, kdrum has had a few takes like this lately. For someone who’s been very attentive to data & reasonably deferential to empirical work, especially in economics, he occasionally seems in a hurry to have a contrary take on some topic or article. I’m not sure why. He’s given no indication that his health has deteriorated; quite the opposite, he’s indicated that his multiple myeloma is well controlled right now.
https://news.cgtn.com/news/2021-09-07/Chinese-mainland-reports-36-new-confirmed-COVID-19-cases-13m2qGvXLEY/index.html
September 7, 2021
Chinese mainland reports 36 new COVID-19 cases
The Chinese mainland recorded 36 new confirmed COVID-19 cases on Monday, all from overseas, the latest data from the National Health Commission showed on Tuesday.
In addition, 10 new asymptomatic cases were recorded, while 401 asymptomatic patients remain under medical observation.
This brings the number of confirmed COVID-19 cases on the Chinese mainland to 95,064, with the death toll unchanged at 4,636.
Chinese mainland new locally transmitted cases
https://news.cgtn.com/news/2021-09-06/Chinese-mainland-reports-18-new-confirmed-COVID-19-cases-13kp2fMfFE4/img/5e6ae4d463a249cc81cd4870308eaeaf/5e6ae4d463a249cc81cd4870308eaeaf.jpeg
Chinese mainland new imported cases
https://news.cgtn.com/news/2021-09-07/Chinese-mainland-reports-36-new-confirmed-COVID-19-cases-13m2qGvXLEY/img/69a7769bf754459cacbfe085706a4600/69a7769bf754459cacbfe085706a4600.jpeg
Chinese mainland new asymptomatic cases
https://news.cgtn.com/news/2021-09-07/Chinese-mainland-reports-36-new-confirmed-COVID-19-cases-13m2qGvXLEY/img/6f33b9c005bd48989b38e6df08363d76/6f33b9c005bd48989b38e6df08363d76.jpeg
http://www.news.cn/english/2021-09/07/c_1310173518.htm
September 7, 2021
Over 2.11 bln doses of COVID-19 vaccines administered in China
BEIJING — Over 2.11 billion doses of COVID-19 vaccines had been administered in China as of Monday, data from the National Health Commission (NHC) showed Tuesday.
More than 1.09 billion people or 77.6 percent of the country’s total population had received at least one dose, and over 969.7 million people had been fully vaccinated against COVID-19 by the end of Monday, said Wu Liangyou, deputy head of the NHC’s disease control and prevention division.
Nearly 162.3 million doses of COVID-19 vaccines had been administered among minors aged between 12 and 17, Wu told a press conference.
https://www.worldometers.info/coronavirus/
September 7, 2021
Coronavirus
United Kingdom
Cases ( 7,056,106)
Deaths ( 133,483)
Deaths per million ( 1,954)
China
Cases ( 95,064)
Deaths ( 4,636)
Deaths per million ( 3)
https://www.nytimes.com/2021/09/07/opinion/covid-relief-economy.html
September 7, 2021
Here Comes the Autumn of Anxiety
By Paul Krugman
In the heady days of spring, when the United States was vaccinating 3 million people a day, President Biden predicted a “summer of joy.” But then the vaccination campaign stalled, and the Delta variant fueled a new wave of infections, hospitalizations and deaths.
This didn’t have to happen. True, Delta’s contagiousness has led to rising caseloads almost everywhere. But America has pulled away from other advanced countries in hospitalizations and deaths:
https://static01.nyt.com/images/2021/09/07/opinion/krugman070921_2/krugman070921_2-jumbo.png?quality=90&auto=webp
There’s no mystery about why this has happened: It’s political. True, there are many Americans refusing to take the vaccines for nonpolitical reasons. There’s general distrust of authority figures, there’s distorted word of mouth — a friend of a friend heard about someone who had a bad reaction. (Even in my sheltered social set, I know people like that.) But the systematic refusal to get vaccinated, refusal to wear masks, etc., is very clearly tied to the unique way that common-sense public health measures have been caught up in the culture war.
According to a recent NBC poll, 91 percent of Biden voters have been vaccinated but only 50 percent of Trump voters. Or look at death tolls: Blue states look more like Canada or Germany than like Florida or Texas:
https://static01.nyt.com/images/2021/09/07/opinion/krugman070921_3/krugman070921_3-jumbo.png?quality=90&auto=webp
And aside from, you know, killing people, the politically driven Covid resurgence is taking an economic toll….
Krugman needs to stop misleading. Florida, Hispanics are leading the way by far. Adjust for education, stop parroting Kaiser lies. 91% of Biden voters aren’t vaccinated. Matter of fact, it’s slowing to a crawl due to progressive naturopathic elitists not vaccinating.
your statement is simply false. if this were twitter, you would be flagged for misinformation.
GREGORY BOTT: Please explain how “Kaiser lies”. And where does your “91% of Biden voters” aren’t vaccinated item come from?
You know this because Breitbart told you so?
Speaking of….. this deems keeping an eye on.
https://www.cnn.com/videos/tv/2021/09/07/exp-tsr-todd-warnings-ahead-of-rally-for-rioters-sept-18.cnn
Andrew McCabe didn’t just get off the Greyhound bus. If McCabe thinks this is important, then I would say it is. If Democrats drop the ball on a sufficient National Guard presence near many D.C. government buildings there will be no orange abomination to blame.
https://www.cnn.com/2021/09/06/politics/september-18-rally-dc-andrew-mccabe-cnntv/index.html
Well, GB, in my little universe of older Biden voters, numbering in the teens, EVERYONE is vaccinated. In California where Biden got 11 million votes, your number would indicate 10 million Biden voters aren’t vaccinated.
Don’t think so. There are, by today’s numbers, 27.5 million Californians with at least one dose, 22.3 million fully vaccinated.
the coronavirus is eliminating one maga voter at a time…have we ever seen a more dramatic darwinian experiment in real time?
File this one under beef is a dirty business when the Big Four accounting firms team up with lawyers to conceal blatant tax evasion:
https://www.smh.com.au/business/banking-and-finance/ato-launches-legal-action-against-accounting-giant-pwc-meat-processor-jbs-20200604-p54zmh.html
JBS apparently is a Brazilian multinational that produces beef distributed to Australian customers. Hamburgers for dinner maybe? Apparently PwC does their accounting in Australian and the Australian Tax Office (ATO) thinks something is amiss so they have demanded key information be turned over in an audit. Routine stuff and accounting firms do not have attorney client privilege. Oh wait bring in the big shot lawyers to shield any damning information. Donald Trump would be impressed.
But the ATO is not suing PwC. Ok – a bunch of overpriced worthless accountants may have to find real jobs!
macroduck: “So while the Delta variant is doing a pretty good job infecting anyone available to infect, it’s easy to see why models would anticipate a peak soon.”
Don’t be fooled by the drop off in cases in that CDC chart you linked. That is an artifact due to most states not reporting cases during the three-day weekend. You are going to see some big numbers posted in the next few days as the statistics catch up.
“macroduck: “Herd immunity doesn’t work very well on Delta.”
I wouldn’t give up so easily. The U.S. hasn’t really tried. Vaccination rates in the U.S. are barely 50% for Covid. For measles, mumps, rubella, polio, tetanus, diphtheria, pertussis, hepatitis, etc there is near universal vaccination (92% to 95%).
Herd immunity can be achieved. It only requires the will to do so. The U.S. has long had universal vaccination mandates for the U.S. military and all U.S. immigrants for all the common diseases noted above. It shouldn’t be that big a deal to have a covid vaccination mandate for everyone.
Sammy wanted to dismiss Ida as not making his top ten list. Of course his list was compiled in 2016 and has not been updated. But check out the number of power poles taken down by what Sammy considers an insignificant hurricane:
https://www.cnn.com/2021/09/07/us/hurricane-ida-aftermath-louisiana-tuesday/index.html
We have perhaps the most ignorant of all comments seen to date. ” But check out the number of power poles taken down by what Sammy considers an insignificant hurricane.” PGL, now wants to count hurricane damage by ?POWER POLES? REMARKEDLY, HE WAS RESPONDING TO A COMMENT ABOUT HIS SELECTION BIAS.
I dunno, but by selecting power poles as a measure, it appears that he just confirmed that bias.
Yet, there were other comments about the currency/recentness of Sammy’s 2016 reference. Here we have a 6/21 count of most dangerous, based upon deaths, hurricanes in US history since the 1800s: https://bestlifeonline.com/deadliest-storms-us-news/
How many power poles were used in the 19th century or even earlier?
YUP! The liberal mind does amaze.
deaths are not a real good measure of hurricanes from an historical perspective. our ability to predict and evacuate is much better than in the past. galveston should not have lost a single life if they had the technology available today. and if you placed new orleans back in the early 1900’s when katrina hit, the death toll would have been much greater. Nobody would have survived the mississippi coast where the storm surge struck, if there had not been evacuations resulting form storm surge predictions. deaths are also a function of location. hurricane michael is not on the list of either corev or sammy. this was one of the very few category 5 storms to strike the us mainland. fortunately, it struck in an area with a low population.
that said, it is realistic that ida will land in most top 10 lists when all is said and done. it created major damage from louisiana all the way to new york.
if you want to see how common strong storms are, and when they occurred, this is a good list to examine
https://en.wikipedia.org/wiki/List_of_the_most_intense_tropical_cyclones#North_Atlantic_Ocean
If you notice, there is a lot of activity in the atlantic basin since 2000. also, we are seeing more recent storms appear to have more damaging rainfall levels than in the past. high winds are not the only measure of hurricane damage.
I’m no fan of Wikipedia but it is a whole lot more reliable than the parade of disinformation from Sammy and CoRev.
Just laughing at pgl.
CoRev: That’s fine. We all laugh at you, CoRev.
https://econbrowser.com/archives/2021/05/relative-vs-general-price-changes
https://econbrowser.com/archives/2020/09/for-the-innumerate
https://econbrowser.com/archives/2020/08/mendacity-watch-covid-19-fatality-rate-and-the-swedish-success
https://econbrowser.com/archives/2019/06/why-friends-dont-let-friends-apply-deterministic-time-trends-to-nonfarm-payroll-employment
https://econbrowser.com/archives/2019/07/predictions-of-soybean-prices-from-one-year-ago
https://econbrowser.com/archives/2019/04/data-sources-again
https://econbrowser.com/archives/2019/03/its-a-big-if-that-soybeans-futures-are-long-term-predictors-at-all
Menzie, just laughing even more, but now at you. Why did you not add this from that comment? ” We are just seeing the start of this building inflation bubble. We will see more and more longer/lengthy comparisons to camouflage and lower the inflation differences, but they will fail to forestall their coming defeat in the midterm election.”
Since that comment was from may 2021we’ve had many, many articles HERE about inflation. This article is perhaps for me the funniest https://econbrowser.com/archives/2021/07/inflation-now-and-70-years-ago as it tries to prove that today’s inflation isn’t quite so bad as 70+ years ago. Ne4eded to go that far back to show a contemporary inflation bubble?
Then we have this article which has a nice graph showing the contemporary CPI inflation bubble. https://econbrowser.com/archives/2021/08/inflation-outlook-looking-forward-to-august-data – https://econbrowser.com/wp-content/uploads/2021/07/inflationnow_korean.png
The midterms elections are coming, and they should be more than just interesting. This is the guy and party policies you chose.
Five serious Hurricanes from 2017 to 2020?! Yep – it was God punishing the US for allowing Donald John Trump in the White House. Maybe this is the climate change deniers explanation?!
I see you selected another Wiki-based metric for rating hurricane damage. From that I take it you are also Baffled by a power pole measurement for damage? After that you seemed to down play property damage and/or deaths as a metric by citing hurricane michael as a Cat 5 storm.
So what are your preferred metrics? You claim: “deaths are not a real good measure of hurricanes from an historical perspective.”
and
” high winds are not the only measure of hurricane damage.”. Just wondering as you seem as you seem more than a little confused. maybe you do believe the best measure is power pole damage?
Nothing i stated was inaccurate corev.
Baffled, accurate? Accuracy has nothing to do with confusion over metrics when nearly all the major metrics are cited. Do you believe Pgl’s power pole metric accurate?
i don’t think pgl used that as a metric. he used it as an example. you are the one who jumped up and down and called it a metric.
i was very clear. if you use death as a metric, you need to understand there is a historical bias to the list. and i explained why.
if you are talking about wind speed or air pressure, then you have much less historical bias. we have better measuring devices, sure. but that pales in comparison to our ability to warn about pending hurricane strikes, and that impact on potential loss of life. as i said before, Galveston should not have a remotely similar death toll today. metrics on the physical strength of hurricanes indicate we are seeing stronger ones more frequently.
corev, you simply seem to be looking to complain about something, irregardless of whether it is relevant or not. did you wake up grouchy today?
Baffled: “i don’t think pgl used that as a metric. he used it as an example.” An example of a metric for a hurricane’s significance: “But check out the number of power poles taken down by what Sammy considers an insignificant hurricane”.
I see you don’t read very well. Nor do you want to commit to a metric.
its not presented as a metric. just an example. i can read it just fine. you are trying to read too much into the comment.
i have told you air pressure and wind speed. fine metrics if you want to compare the strength of storms over time.
if you want to use a metric to describe damage, that is the type of metric that needs to be qualified over time. already explained this to you. again, you seem to want to complain. corev, are you just a grouch today, or is this the typical feeling you have every day?
baffling,
A sign of your point is that several of those hurricanes on that top ten deaths list, notably a couple from the 1800s, were only category 1 or 3. Yeah, back then not very strong hurricanes could kill a lot of people pretty easily.
Climate change deniers unite! First of all I never said Ida was the deadliest ever. Secondly these were hurricanes rather spaced out over a century. I guess you and Sammy have not noticed the frequency of serious hurricanes of late even if one the comments you chose to ridicule made the very same point.
But note also we did not have FEMA under Jimmy Carter created it. We did not have the current systems to minimize the suffering in deaths generations ago. So even the number of deaths is not exactly the most enlightening single statistic for comparing the severity of storms over the years. Now I did not say power poles was the singular statistic but if you live in the South, you might actually get the importance of getting electricity back on line.
But do help Sammy with his climate change denial stupidity as he really needs all the help he can get.
Pgl, I chose to ridicule your comment because it was both ignorant and confirmed Sammy’s point of your confirmation bias. Everything since has just confirmed your own ignorance by adding even another metric set, serious hurricanes. How many power poles are included with measuring the seriousness of a storm?
Well, CR, if there’s anyone who knows about ignorant comments, you certainly are near the top of the list.
Here’s a list from 2019: https://www.nationalgeographic.org/interactive/ten-most-damaging-hurricanes-us-history/
The years? 1926, 2005, 1900, 1915, 1992, 1938, 1944, 2012, 1928, 1960
Lord – you do know that there were some severe storms in 2020. Or are you really this incredibly dumb?
i see Torsten Slok’s comment about Delta peaking was the day before fans in college football stadiums across the country were packed shoulder to shoulder without masks; here’s Wisconsin:
https://www.youtube.com/watch?v=SowZGXMuOac
Delta must have had a field day…
Eh, so “Nfp” was down. It’s clearly a laggard. It’s meant to be that way. Other indicators don’t agree, which are better short term indicators. Being it’s August when government jobs get whacked, August was pretty solid.
“Nfp”, as you call it, was up 235,000, not down.
GREGORY BOTT: I’ve seen this assertion that NFP from CES is lagging relative to employment from CPS, but I’ve never seen documentation. (Actually, I don’t know what the other indicators that you vaguely refer to are, so I’m guessing here). Note the CPS-based employment series adjusted to NFP concept declines in August.
BOTTs do not rely on reliable sources as they are pre-programmed to just make up one lie after another.
Her’s some Bott math. Bott says 91 % of Biden voters are unvaccinated. That would mean only 1 million of the 11 million Californians who voted for Biden are vaccinated. Subtract that from 22.7 million who are fully vaccinated.
Then remember Trump got 6 million votes, but polls show large numbers of Trump voters aren’t vaccinated.
Mystery to be solved by Dr. Bott: explain the millions who are vaccinated but who didn’t vote. Or, better yet, if all 6 million Trump voters are vaccinated (calls for laughter) and only a million Biden voters have been jabbed (more laughter) how does Bottlogic or Bottdata account for the remaining 15 million fully vaccinated?
You do realize there is no “91%” . It’s a made up number. Your whole post does not respect what a Sampling bias is. Please learn it and try to find real aggregates.
What part of “91% of Biden voters aren’t vaccinated” did I misunderstand? You do realize YOU wrote that? Maybe you should sample what you write and learn to better express yourself.
bot, if you want to make that argument, ok. but will you then acknowledge that every time trump bragged about how the polls showed him winning HUGELY, the poll was full of bias and not worth repeating?
by the way, the nbc poll was professionally conducted, unlike the poll results trump usually touted from magaclickbate.com, where you could win a years supply of hydroxychloroquine for playing while watching peter schiff hawk gold to retirees.
If there’s a labor shortage, it should show up somewhere in the numbers.
1. In the first two+ years of the earliest job openings data (Dec 2000-Apr 2003), openings divided by non-institutionalized 20+ year olds – everyone, not just the labor force – fell from 2.5% to 1.5%. Gee, do you think there was a recession?
2. It then recovered to better than 2% for five years, until Mar 2008. Call it a recovery.
3. Crash! Bang! BOOM! Over 16 months, the ratio fell to 1%, then crawls back over nearly five years to 2% in April 2014.
4. And on up, breaking 3% in mid-2018 and holding close to that level until the pandemic.
5. Since March 2020, this ratio has gained more than 1.7 points, and was at 4.1% at mid-year.
short discussion on the current labor issues.
https://www.wkyc.com/article/money/business/federal-unemployment-benefits-close-the-gap-on-the-worker-shortage/95-d367400c-6b30-414f-9685-0fe75ddac8d0
here another economist points out he does not believe the expiration in unemployment benefits will bring back workers. he feels there are other bigger factors at play. but i found something interesting. they interviewed the owner of a pancake house. he is having a hard time filling positions. but he ended with this statement
““I think our July was our best month ever,” says Frazin. “So, business is great. I can’t complain. It’s almost too busy and I just want to retire so, I’m very thankful.””
so apparently, the difficulty in workers is not really impacting at least some businesses, on the bottom line. but his last comment was also rather telling. he is ready to retire and get out of the workforce. this is an owner who is ready to leave the workforce. it seems it is not just low wage workers who are not interested in working anymore.