In Jim’s review of the Q3 advance release, he noted disappointments in residential investment. What is also worrying is the deceleration in real business fixed investment growth, and the decline in equipment investment.
“[I]t’s a big IF that soybeans futures are LONG TERM predictors at all”
That’s a quote from an Econbrowser reader who is almost uniformly wrong on all matters related to economics, but it seems useful to me to provide the empirical evidence on futures as predictors, especially as noted in a recent post rising commodity prices have put upward pressure on inflation rates. Further, with the efficiency of futures markets might have changed over time, with greater financialization.
GDP growth: is this as good as it gets?
The Bureau of Economic Analysis announced today that seasonally adjusted U.S. real GDP grew at a 2% annual rate in the third quarter, slightly below the average growth rate of 2.25% that we saw during the previous economic expansion.
Continue reading
Guest Contribution: “High oil prices can help the environment”
Today, we present a guest post written by Jeffrey Frankel, Harpel Professor at Harvard’s Kennedy School of Government, and formerly a member of the White House Council of Economic Advisers. A shorter version appeared at Project Syndicate.
GDP vs. Human Development Index: US, China and Norway
Several commentators (e.g., [1] [2]) keep on taking me to task for citing GDP as if it was the variable of ultimate concern. I have repeatedly noted GDP is a measure of economic activity, not a measure of economic welfare. However, in order to deter these repetitive and sometimes sententious comments, I’ll provide some graphs to illustrate the difference between a measure of economic activity, and a measure of welfare.
Updating GDP Nowcasts (updated 10/28)
Data out of BEA today shows 2% q/q SAAR growth in Q3 – but all of it can be accounted for by the 2.7% contribution from inventories. Jim will be presenting his views on the Q3 release later today.
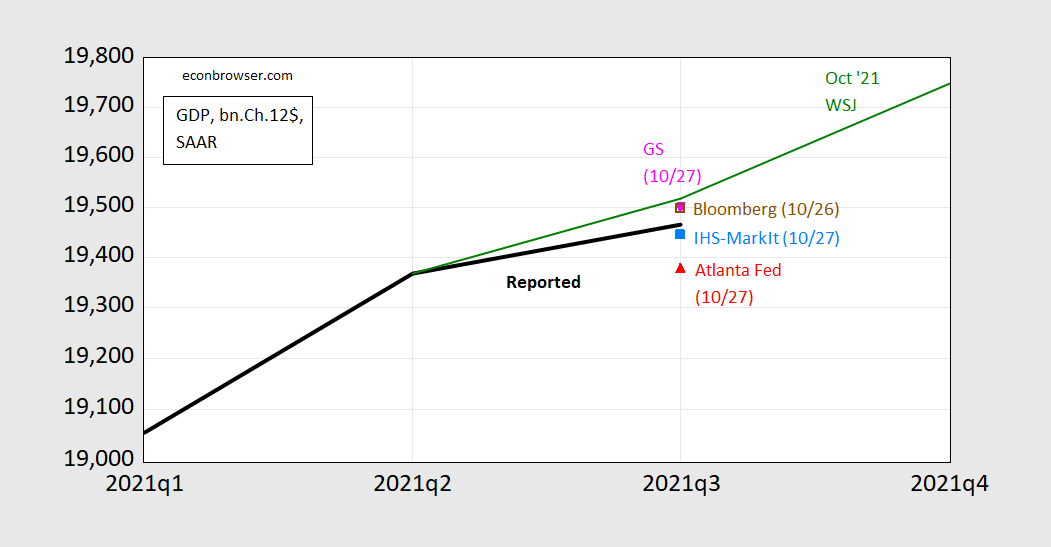
Updated Figure 1: GDP, 2021Q3 advance release (black), implied GDP from Atlanta Fed 10/27 nowcast (red triangle), IHS-MarkIt 10/27 (sky blue square), Bloomberg consensus 10/26 (brown square), Goldman Sachs 10/27 tracking forecast (inverted pink triangle), and mean forecast from WSJ October survey (green line). Levels calculated using reported growth rates and latest GDP for Q2. Source: Atlanta Fed, IHS-Markit, Bloomberg, Goldman-Sachs, WSJ October survey, and author’s calculations.
Atlanta Fed nowcast cut from 0.4% to 0.2% q/q SAAR, Goldman Sachs from 3.25% to 2.27%. This revises the graph in yesterday’s post.
Economists Are Remarkably Bad at Forecasting Short Term Interest Rates
I was looking at survey based forecast errors for short term interest rates, when I generated this graph. It’s certainly a humbling picture.
Nowcasts and Nowcasts, on the Eve of the Q3 Release
ZeroHedge breathlessly announces “Atlanta Fed Says US Economy Suddenly On Verge Of Contraction”. The title is numerically correct, and the article actually provides more context than usual. However, for perspective, I think it’s of interest to see what other organizations are nowcasting.
Be Careful with Simple Treasury-TIPS Spreads
The five year Treasury-TIPS spread has, inarguably, shot up:
The Relative Price of Oil – Levels vs. Growth Rates
I hear a lot about “records”. Not so remarkable in levels, but very remarkable in growth rates.