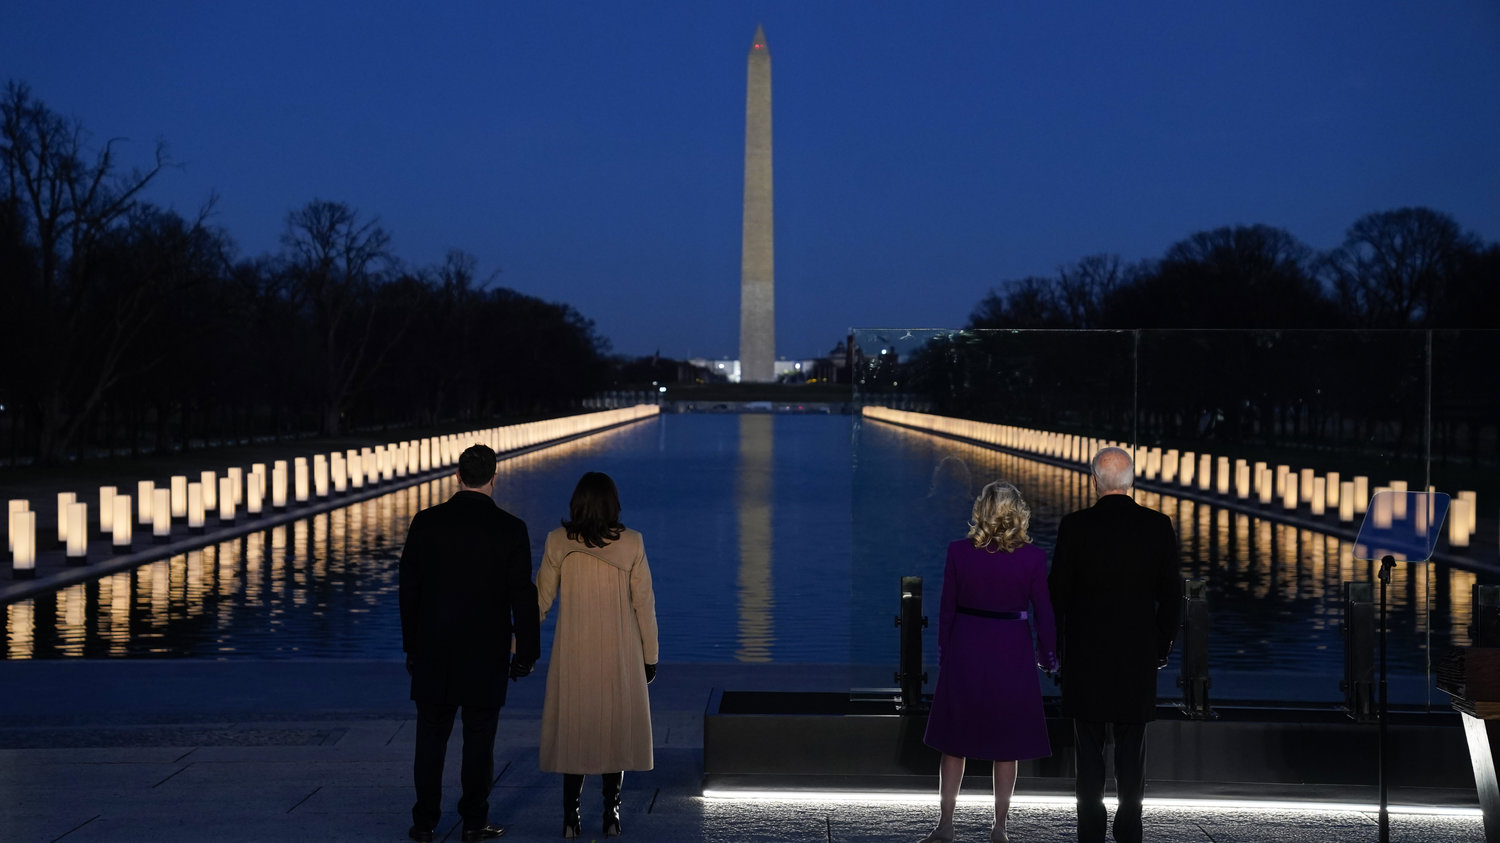
In America, have we ever by policy rather than by law separated family members, including children, from other family members, while awaiting processing? The answer is yes, and we don’t need to go too far back in history.
45 Years of Nominal Soybean Prices
Source:Source: MacroTrends.
Soybean Futures in Free Fall: Front and Back Months
Reader Ed Hanson asks if it makes a difference to look at front month or back month futures in discerning the impact of news on soybean prices. The answer is no.
Below, I present graphs of soybean futures over the past year for contracts expiring in July, August, September, November, and January 2019 (all accessed on 6/15, from ino.com):
Continue reading
On the Eve of Disruption
(Apologies to P.F.S./B.McG) Soybean, hog prices and corn prices dove even before the Section 301 import tax hit list was announced. (Orange dashed line denotes Trump announcing imminent Section 232 tariffs). Why?
Wisconsin NFP Employment Continues Decline
It’s below peak, and April numbers revised down.Private employment 17,500 below Governor Walker’s target of an additional 250,000 jobs by January 2015. From WI DWD today.
Figure 1: Nonfarm payroll employment in Minnesota (blue), Wisconsin (red), and US (black), all in logs normalized to 2011M01=0. Light green shaded dates indicates data not yet benchmarked using QCEW data. Source: WI DWD, MN DEED, BLS and author’s calculations.
Continue reading
Guest Contribution: “Red and Blue: One Country or Two?”
Today we are fortunate to have a guest contribution by Helen Popper, professor of economics at Santa Clara University.
Democrats and Republicans differ. Blue and Red states differ. Blue and Red economies differ; but, how different are they? Are they as different as economies from two distinct countries?
Why Consult Ag Futures?
Because, they’re pretty good predictors of future prices (at least at the 3 and 12 month horizons) — better than a random walk, and better than a time series model. For empirics on corn, wheat and soybeans, see Chinn and Coibion, Journal of Futures Markets (2014).
And in Ohio…Contemplating 25% Tariffs on Soybeans
From Brown, Sheldon,AEDE Agricultural Report 2018-001, May 2018:
Through calculations made based on a representative west central Ohio farm, and assuming an average degree of Chinese substitution between U.S. and Brazilian soybean import, it is estimated that average net income per year (2018-2024) would drop from $63,577 to $26,107 under the proposed tariff, which translates to a 59% decrease in net farm income.
The US tariffs on steel and Chinese retaliation induces this effect through “higher machinery costs, lower corn, soybean and pork prices for U.S. agricultural producers”.
Meanwhile, Back in Iowa
Soybean prices continue to collapse…
Source: ino.com, accessed 6/13.
Note that the peak was in early March, just as Mr. Trump hinted at Section 232 tariffs on aluminum and steel. This additional pain is unwelcome, given that even as of March, soybean prices were some 40% below their mid-2012 peaks.
From Progressive Farmer – Washington Insider today:
Anxiety Rising In US Farm Circles On China Trade
The U.S. has signaled it will make its intentions known by Friday on duties on some $50 billion in Chinese goods over intellectual property issues.U.S. ag interests like the American Soybean Association (ASA) are planning a full-court press to try and convince the administration to not take actions that would negatively impact U.S. soybean and other ag trade as China has threatened to respond with retaliatory trade actions against U.S. products like soybeans and other ag goods.
It’s not clear whether the U.S.-North Korea summit was enough to have the U.S. willing to hold off on imposing sanctions against China. But there are also still likely other steps in the process before U.S. sanctions go into place.
The U.S. has to publish a formal determination on the duties in the Federal Register, with up to 30 days after that point for the duties to come into effect. Plus, indications are the Trump administration is studying taking up to another 180 days before putting the duties in place.
As a reminder, here is a map of soybean production.
Source: USDA.
Deep State Speaks…from Within the White House
From United States Trade Representative (USTR), within the Executive Office of the President, headed by Robert Lighthizer, hand-picked by Mr. Trump:
When, oh, when, will we be rid of these conniving back-stabbers?