EconoFact has been providing insights into the current health/economic crisis. Here is a compendium:
Guest Contribution: “Banks on the Brink”
Today we are fortunate to be able to present a guest contribution written by Mark Copelovitch (University of Wisconsin – Madison) and David Singer (MIT).
Guest Contribution: “Macroeconomic nowcasting in times of Covid-19 crisis: On the usefulness of alternative data”
Today, we are pleased to present a guest contribution written by Laurent Ferrara (SKEMA Business School and QuantCube Technology), Alice Froidevaux (QuantCube Technology) and Thanh-Long Huynh (QuantCube Technology).
Guest Contribution: “Charting This Crisis”
Today, we are fortunate to present a guest contribution written by Ashoka Mody, Charles and Marie Visiting Professor in International Economic Policy, Woodrow Wilson School, Princeton University. Previously, he was Deputy Director in the International Monetary Fund’s Research and European Departments. He is the author of “EuroTragedy: A Drama in Nine Acts,” recently updated with a new afterword.
Guest Contribution: “Oceans Apart? China and Other Systemically Important Economies”
Today we are pleased to present a guest contribution written by Hongyi Chen, Senior Advisor at the Hong Kong Institute for Monetary and Financial Research, and Pierre Siklos, Professor of Economics at Wilfrid Laurier University.
Coping with the COVID-19 economic shock
Every recession is different. The recession of 2020 will not be an exception to that rule.
Continue reading
GDP Forecasts (updated 3/21)
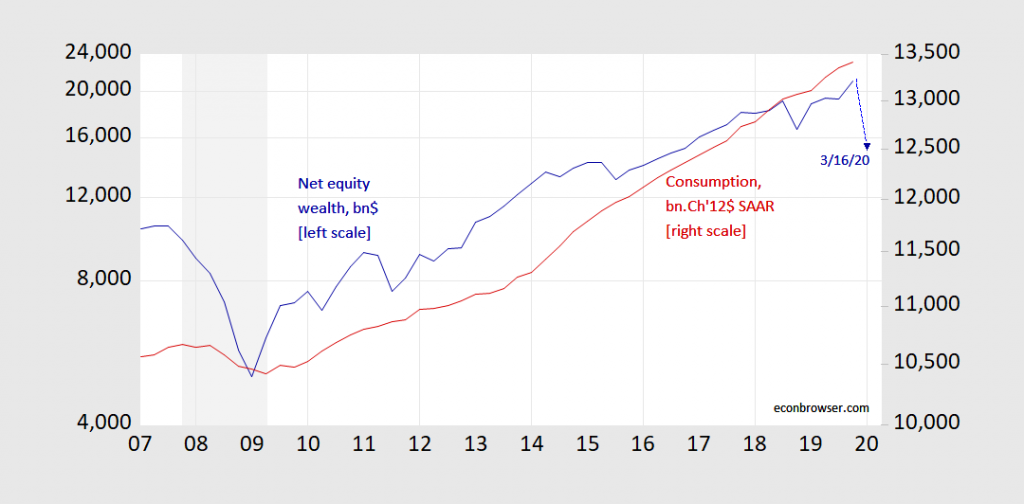
Equity Wealth and Consumption
Figure 1: Household equity wealth, in billions dollars (blue, left log scale), and estimated based on Russell 5000 (blue triangle at 2020Q1), and consumption, in billions Ch.2012$ SAAR (red, right log scale). Source: Fed Flow of Funds, via FRED, BEA 2019Q4 2nd release, and author’s calculations.
Note that scales are in logs. The picture looks a lot worse in levels.
On the other hand, equities net worth is only about 18% of total net worth in 2019Q4.
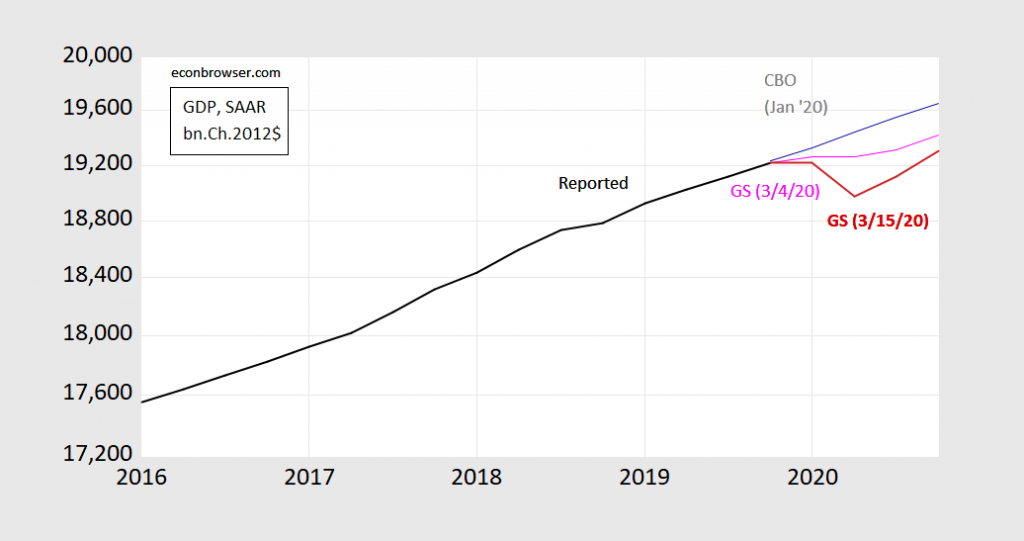
The Deterioration in the Economic Outlook
Goldman Sachs reported out their forecast. Don’t be deceived by the “snapback” in growth rates…the levels look grim.
Figure 1: GDP (black), CBO January 2020 forecast (gray), Goldman Sachs March 4 forecast (pink), Goldman Sachs March 15 forecast, all in bn.Ch.2012$, SAAR. Source: BEA 2019Q4 2nd release, CBO Budget and Economic Outlook (January 2020), Goldman Sachs, and author’s calculations.
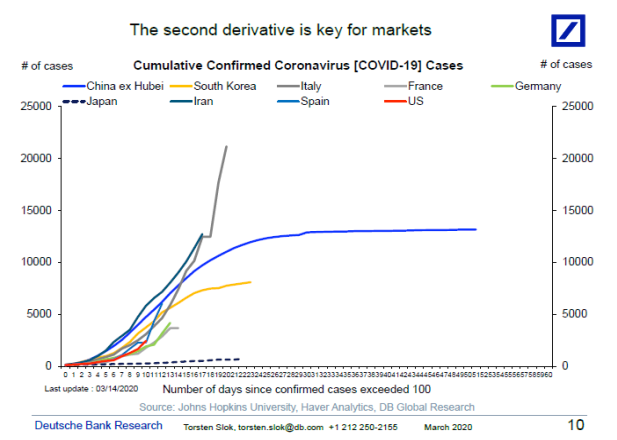
CDC Estimates of the Covid-19 Toll
[Update – Figure added 3/14 1:30pm Central. Source: Torsten Slok, DB.]
From The Hill today:
One model from the Centers for Disease Control and Prevention (CDC) suggested that between 160 million and 210 million Americans could contract the disease over as long as a year. Based on mortality data and current hospital capacity, the number of deaths under the CDC’s scenarios ranged from 200,000 to as many as 1.7 million.
It found as many as 21 million people might need hospitalization, a daunting figure in a nation with just about 925,000 hospital beds.


