For now, we know as of 2019Q4, we’re not in a recession, according to Jim’s analysis. But Q4/Q4 GDP growth fails to hit Trump targets (again!), business cycle indicators continue to plug along, but RV sales plunge 16% y/y. And yield curve inverts (again)! Is it flight to safety or lower expected future short rates?
Steady growth continues
The Bureau of Economic Analysis announced yesterday that U.S. real GDP grew at a 2.1% annual rate in the fourth quarter of 2019. That’s slightly below the 2.3% average rate since the recovery from the Great Recession began in 2009:Q3.
Continue reading
Forward Looking Components in GDP
Jim will be writing a more comprehensive assessment of the 2019Q4 advance GDP release tomorrow. For now, I’ll just note that business fixed investment, a forward looking variable, has registered a negative decline for the last three quarters of 2019.
Business Cycle Indicators as of 1/29 as Real 10 Year Rate Goes Negative
Monthly GDP growth is slow in December:
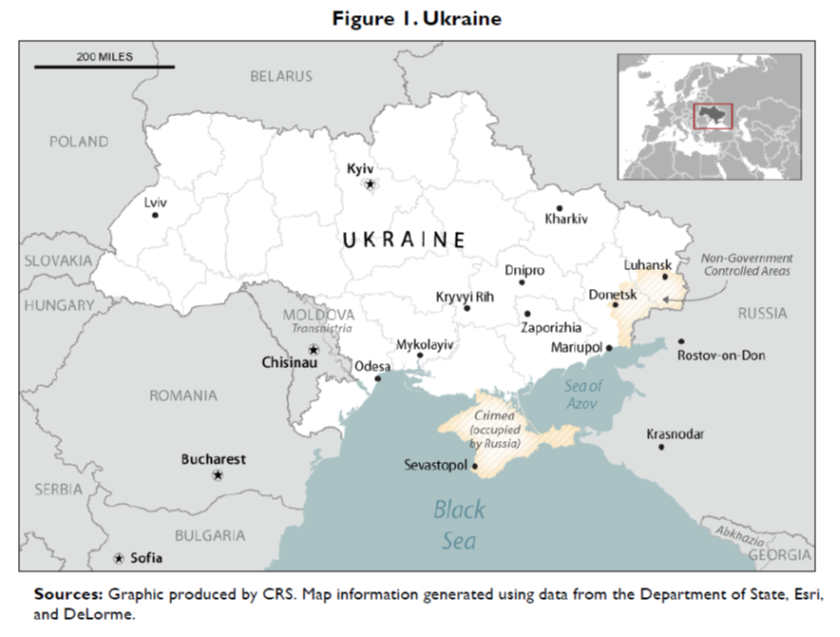
What Is the Size of Russian Forces in Ukraine?
What Determines the Strength of Interest Rate Linkages between Countries?
Decisions regarding the trilemma, but also choices regarding macroprudential policies have an impact. From the revised version of Joshua Aizenman, Menzie Chinn and Hiro Ito, “Financial Spillovers and Macroprudential Policies” (forthcoming Open Economies Review):
Back to Zero — and Beyond! [updated]
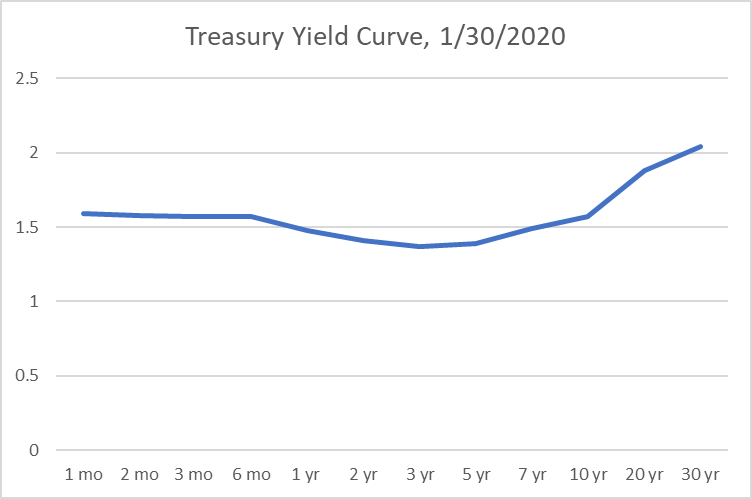
Updated 1/30/2020 – Treasury yield curve inverted relative to 1 month all the way out to somewhere between 10yrs and 20yrs!
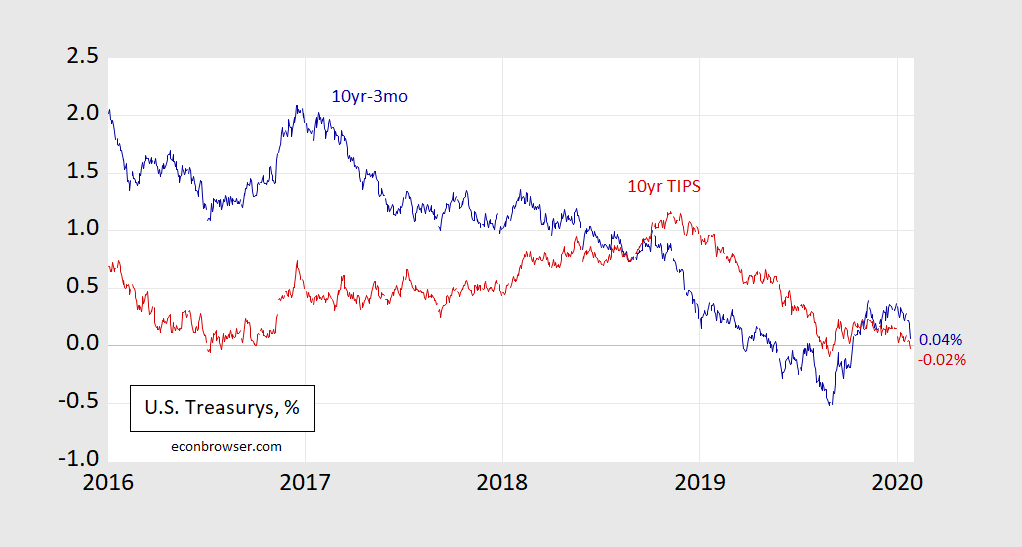
Ten year TIPS yields that is; the 10yr-3mo spread is 4 bps.
Figure 1: Ten year – three month Treasury spread (blue), and Ten year TIPS yield (red), both in %. Source: Federal Reserve via FRED, Treasury, and author’s calculations.
The Relative Price of Soybeans vs. Grains, 2014-2019
Reader Ed Hanson insists I plot soybean prices from 2014 onward, instead of 2016, to show how factors other than tariffs affect soybean prices. I am happy to accommodate his request. I wonder why soybean prices suddenly deviate from grains overall, starting in March 2018.
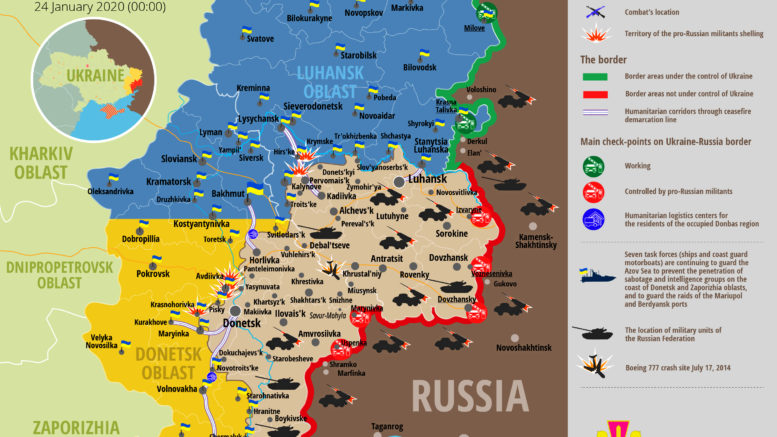
Disposition of Forces in Donbass Region, Ukraine
As of 24 January, according to the Information Analysis Center:
Source: Information Analysis Center.
Discussion of presence of Russian T-72-B3 tanks in Ukraine, here.
Have All Agricultural Commodity Prices Behaved As Did Soybean Prices?
That’s what reader sammy asserts, trying to support the proposition that Chinese retaliatory tariffs on imports of US soybeans had no impact on US soybean prices.
… chart of soybean prices there are a number of other commodity price charts, such as copper, wheat, coffee etc. They are unaffected by the tariff war yet are remarkably similar to the soybean chart.


