The Federal Reserve has increased the size of its balance sheet by a third of a trillion dollars over the last 15 weeks, returning to tools that a short while ago we thought it had abandoned. But the Fed’s current goal in these operations is quite different from what we had seen earlier.
Continue reading
Guest Contribution: “The Role of Network Effects in the International Transmission of US Monetary Policy”
Today, we are fortunate to be able to present a guest contribution by Stéphane Dees (Banque de France and Univ. Bordeaux) and Alessandro Galesi (Banco de España). The views expressed here are those of the authors and do not necessarily reflect the views of Banque de France, Banco de España, or the Eurosystem.
Madison, WI, December 17th – A March
To Impeach Trump
© Lauren Justice for The New York Times. Protesters gathered outside the Wisconsin State Capitol in Madison, Wis.
Source: Vigdor, “Protesters Clamor for Trump’s Impeachment on Eve of House Votes,” NYT, 17 December 2019.
In Defense of Applying Cointegration Testing and Error Correction Models
In honor of Mark Thoma’s retirement, let me discuss the relevance of one of his papers (coauthored with Tim Duy) regarding the usefulness of imposing cointegrating restrictions.
Guest Contribution: “The currency composition of foreign exchange reserves”
Today, we are pleased to present a guest contribution written Hiro Ito (Portland State University) and Robert N. McCauley (formerly Bank for International Settlements). The views presented represent those of the authors, and not necessarily those of the institutions the authors are or were affilliated with.
The Fama Puzzle at 40
Fama (JME, 1984) was published 35 years ago, but the earlier — perhaps the earliest — appearance of the Fama regression is in Tryon (1979). While the puzzle has largely persisted since then, it has seemingly disappeared since the global financial crisis.
Business Cycle Indicators, December 9th
[Inflation adjusted] Personal income excluding transfers and industrial production are falling in October, even as employment rises in November.
Private nonfarm employment: BLS vs. ADP
The trajectories of the BLS vs. ADP private nonfarm employment series differ, even though for much of the year, the ADP series was above that of BLS.
Probability of Recession: In 12 Months vs. Within 12 Months
With increasing term spreads (or, steepening of the yield curve), fears of imminent recession have waned. Does this make sense?
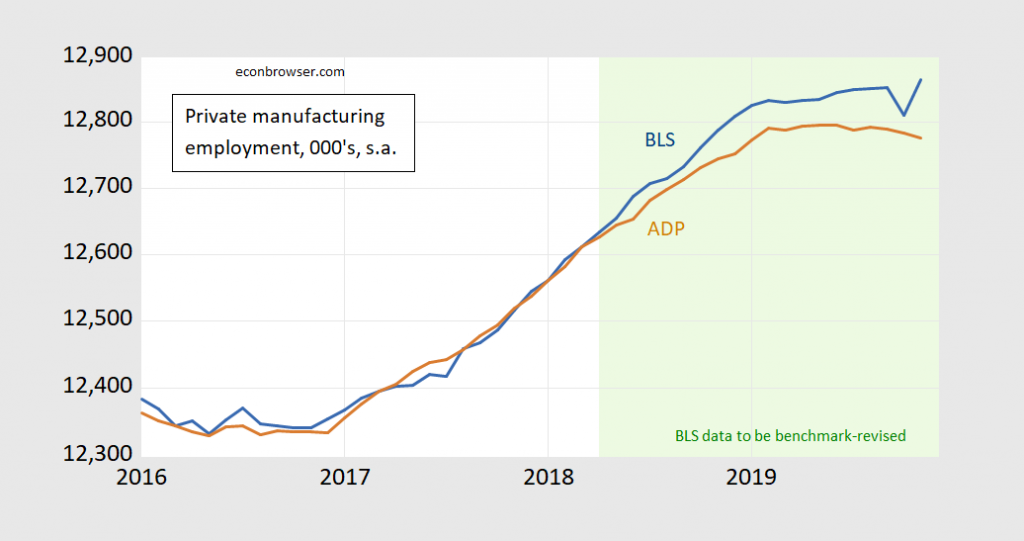
Manufacturing Employment: BLS vs. ADP (updated to incl. Nov BLS)
Figure 1: Manufacturing employment, in 000’s, s.a., from BLS (blue), and from ADP (brown), on log scale. Light green shading denotes data that will be benchmark-revised in February release. Source: BLS and ADP via FRED. [Updated 12/7 to include November BLS data]
Manufacturing peaked a little earlier in the ADP data (June) vs. BLS (August), but ADP suggests a much less pronounced rise to peak during 2019.

