In August, an elevated economic policy uncertainty index was associated with an increasingly inverted yield curve. The measured Economic Policy Uncertainty (EPU) index as of today is 582 (sure to be revised, but still…).
Life Moves Fast: “Will Donald Trump be impeached by year-end 2019?”
56% at noon Pacific today, according to PredictIt:
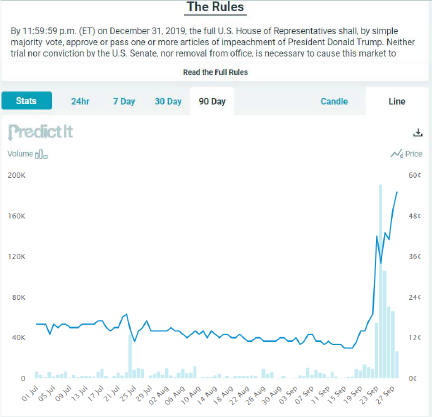
That is, articles of impeachment approved within the next three months.
“The Economic Consequences of Trump’s War on Multilateralism”
That’s the title of my October 18th Global Hot Spots talk, sponsored by the Wisconsin Foundation and Alumni Association (Fluno Center, 1:30-2:30).
Meanwhile, in the Macroeconomy
Business cycle indicators mixed, nowcasts overall sideways, manufacturing down.
Whistle-Blower Complaint: Audio, Text

“A Closer Look at Japan’s Rising Consumption Tax”
That’s an important new Economic Brief by Thomas A. Lubik and Karl Rhodes of the Federal Reserve Bank of Richmond:
Japan plans to raise its national consumption tax next week from 8 percent to 10 percent. Some commentators and economists have blamed previous consumption tax increases for causing recessions in 1997 and 2014, but little statistical analysis has been published to support or refute such claims. This Economic Brief highlights new evidence that significant changes in Japan’s household consumption behavior did in fact coincide with the 1997 tax hike.
This issue is important as Japan is on the cusp of raising its consumption tax in just a few days.
Real Housing Prices Stabilizing … or Falling
Case-Shiller through July, Zillow through August.

Figure 1: Case-Shiller 20 city home price index (blue, left log scale), Zillow forecast of Case-Shiller August value (blue +, left log scale), and Zillow single-family home prices (brown, right log scale). Source: S&P via FRED, Zillow, BLS, and author’s calculations.
As Calculated Risk notes, Zillow makes predictions for the Case-Shiller index. They forecast the August 2019 m/m growth rate (not annualized) in the 20 city composite at -0.1% (roughly -1.2% on an annualized basis). The forecast is shown in Figure 1 as a “+”.
New home sales depict a much more optimistic picture, as Calculated Risk discusses.
An Event Study: Release of “Transcript” of Trump-Zelensky Call
Interesting to see how market prices (Will Donald Trump be impeached in his first term?) jumped, as of 8am Pacific today, as recorded by PredictIt:
PredictIt: “Will Donald Trump be impeached in his first term?”
PredictIt at 11am Pacific today:
Memo from the Midwest: Industry and Agriculture under Trump
Well, over the past year, employment growth has been pretty lackluster in the Midwestern states that Trump was going to revive in terms of manufacturing … and in terms of agriculture…