Today, we are fortunate to present a guest contribution written by Paweł Skrzypczyński, economist at the National Bank of Poland. The views expressed herein are those of the author and should not be attributed to the National Bank of Poland.
Judy Shelton Confuses Me: On Interest Rates, Currency Manipulation
With Judy Shelton’s nomination to be a Fed governor, it behooves us to consider her views on the world. I will point out two salient (there are many) areas of confusion about her views: (1) interest rates and monetary policy easing, and (2) currency manipulation.
The Trump Administration Is No Friend of the Farmer: Part 15,327
Price index for gross value added in farm sector is falling (cumulative 8% under Trump) while that in the nonfarm business is rising (cumulative 3.5%).
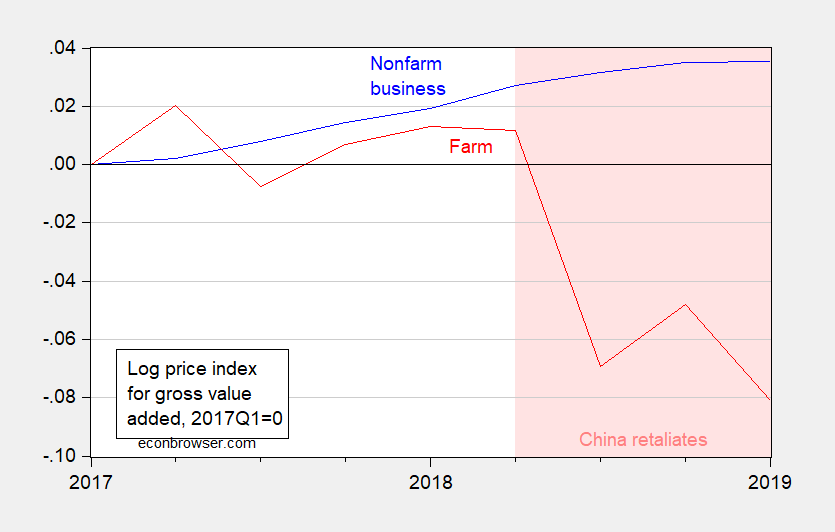
Figure 1: Log price index for gross value added in nonfarm business sector (blue), and farm sector (red), 2017Q1=0. Pink shading denotes period during which China has tariffed US soybeans. Source: BEA 2019Q1 3rd release, authors’ calculations.
Soybean Watch in the Wake of the Trump-Xi Standstill
On July 12th, 2018, the closing price for a CBOT soybean futures contract expiring on July 12, 2019, was 885.75. As of 1:40PM Central on July 2nd, the price of the July 2019 contract was 877.00, 0.99% difference. In other words, soybean futures are (still) doing pretty well in terms of forecasting.
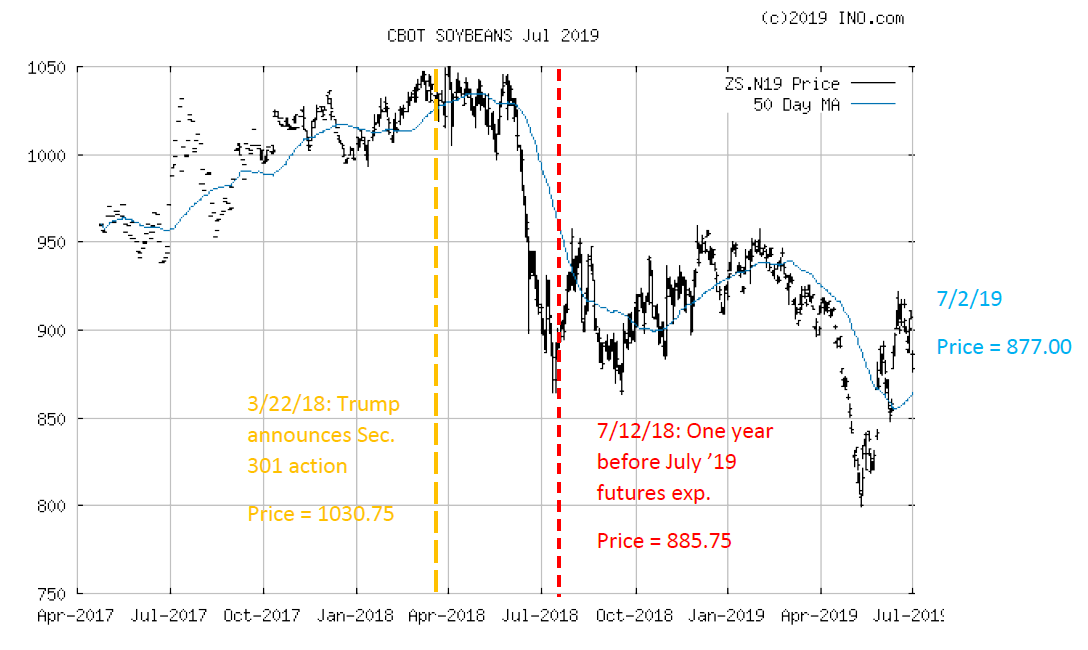
Figure 1: Price of contract for soybeans futures expiring July 2019 (black line), fifty data moving average (blue line). Source: ino.com accessed 7/2 1:40PM, and author’s annotations.
In other words, despite the Trump-Xi trade truce, soybean prices remain mired at where they were nearly a year ago (which is why I think Brad Setsers’ “standstill” better describes the outcome).
Chinese GDP Growth: Now and Near Future
I’ve noticed a tendency for some commentators to believe the Chinese economy is about to topple. One such instance is Gordon Chang writing in the National Interest:
Take the year 2016 as an example. The NBS reported that China’s gross domestic product grew 6.7 percent that year. In 2017, however, the World Bank issued a bar chart showing that China’s GDP increased only 1.1 percent
One has to wonder why in 2019 Chang is citing an unspecified 2017 World Bank report regarding 2016 performance. Well, time to — gasp — look at the data.
Plain-Vanilla Term Spread Model: Recession Probability for 2020M06=42%
(7/1 – with update including credit spread augmented specification.) Estimated probit over 1986M01-2018M06 period (assuming no recession as of 2019M06):
Prob(recessiont+12=1) = -0.323 – 0.869Spreadt
McFadden R2 0.295, observations = 390, bold denotes significance at 5% msl. Spread in percentage points.
Glasnost in Wisconsin, Perestroika to Come?
The Walker Administration tried to hide lackluster economic progress with the suppression of the Wisconsin Economic Outlook, for nearly 4 years (strangely, just like in Brownback’s Kansas). The new Evers administration has resumed publication, and added a set of nifty interactive tools.
The Data Will Make You Free
I am constantly amazed that people write stuff that is easily falsifiable, in an era of easily accessible databases (I am tempted to go into an old fogey rant about “in my day I had to go to the library and hand copy down numbers from the hard copy volumes of International Financial Statistics”…but I will resist). Or ask me for the “raw” data when it’s freely available.
Just to remind the frequent commenters on this blog, there exist freely available data here:
Why Friends Don’t Let Friends Apply Deterministic Time Trends to Nonfarm Payroll Employment
Suppose you wanted to detect anomalies in nonfarm payroll employment (NFP). Would you want to apply a filter that relied on trend stationarity of NFP (like reader CoRev does in his “anomaly analysis”)? My short answer is “no”…