That’s the title of my new paper with Hiro Ito. The US current account deficit (as a share of world GDP) remains, but China’s surplus shrinks…
Empirically Assessing “a whole world of hurt”
That’s how an unidentified White House official characterized the impact of closing the southern border.
Two Years of “Winning”: Messages from GDP, International Investment Releases
The release of the final release for GDP, and the international investment position provides an opportunity to assess progress on the trade war. I for one have gotten tired of “winning”.
Measuring unemployment and labor-force participation
The underlying data from which the U.S. unemployment rate and labor-force participation rate are calculated contain numerous inconsistencies– if one of the numbers economists use is correct, another must be wrong. I’ve recently completed a research paper with Hie Joo Ahn that summarizes these inconsistencies and proposes a reconciliation.
Continue reading
UK Gross Fixed Capital Formation
Why I think the UK is in a world of hurt, regardless of where Brexit goes. It’s just a matter of how bad…
“Integration or Disintegration? The Future of Global Governance and the Global Economy”
That’s the title of the La Follette School Spring Symposium, taking place this Wednesday, 1-6PM at the Wisconsin Memorial Union, ending with:
Assessing the Empirical Work of Stephen Moore
As noted earlier, Stephen Moore has a dearth of peer-reviewed publications; however, he has coauthored work purporting to be analytical. One of these is these is the Economic Outlook ranking published by the American Legislative Exchange Council (ALEC). In Rich States, Poor States, 2015:
“[I]t’s a big IF that soybeans futures are LONG TERM predictors at all.”
AKA CoRev Memorial Post. The quote is from CoRev, and motivated a July 15 post that contained this graph:
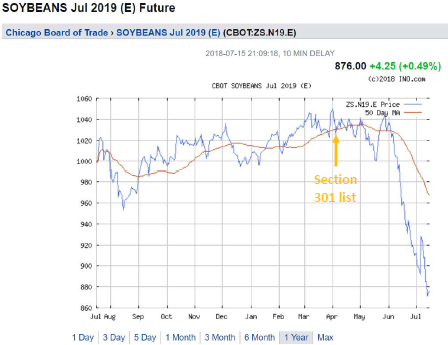
Figure 1: Soybean futures for July 2019. Source: ino.com.
Stop Stephen Moore
From being appointed to the Fed. Here is a non-exhaustive recounting of Moore’s reign of error.
Glenn Rudebusch on “Climate Change and the Federal Reserve”
It doesn’t get much more real than this, when the Fed has to take into account the implications of global climate change. Glenn D. Rudebusch, senior policy advisor and executive vice president at the Federal Reserve Bank of San Francisco, lays out the issues in this letter.