As noted in my last post, the collision of expansionary fiscal and counter-cyclical monetary policy will result in an appreciated dollar. How much more appreciated?
Mr. Trump and the markets
I was astounded not only by the outcome of the U.S. presidential election but also by the response of financial markets.
Continue reading
Implications for the Agricultural Economy of Fiscal Policies Proposed by President Elect-Trump
In short: Rural areas will not like what they get from a combination of expansionary fiscal/counter-cyclical monetary policy.
Guest Contribution: “What Will the Trump Presidency Look Like?”
Today, we present a guest post written by Jeffrey Frankel, Harpel Professor at Harvard’s Kennedy School of Government, and formerly a member of the White House Council of Economic Advisers. A shorter version appeared on November 9th in Project Syndicate.
Economic Policy Uncertainty, November 14

Figure 1: Daily economic policy uncertainty (blue), and centered 7 day moving average (red). Source: PolicyUncertainty, accessed 14 Nov 2016, and author’s calculations.
Today’s value (sure to be revised) exceeds that recorded on 9/18/2001, the previous high in the sample running from 1985 to today.
Links for 2016-11-13
Three papers of interest on the effects of U.S. trade policy on manufacturing employment, racial discrimination, and the Chinese real estate boom.
Continue reading
Thank Goodness We Solved that Problem of Elevated Economic Policy Uncertainty Depressing Growth!
As of today, measured economic policy uncertainty hit 468.
Continue reading
At Long Last, the Feared (Portfolio) Crowding Out Has Materialized
The implication of a (massive) revision to the expected path of government debt relative to baseline is an increase in the slope of the yield curve. Some portion comes from the expectations hypothesis of the term structure, some from an increase in the risk premium. [lecture notes on portfolio crowding out] [lecture notes on expectations hypothesis of term structure]
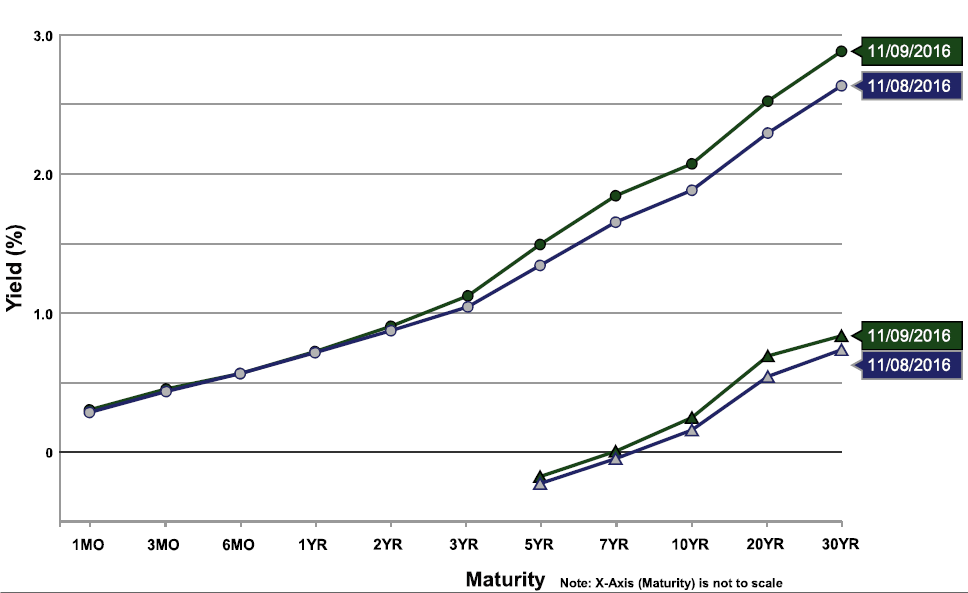
Figure 1: Yield curve as of 8 November (blue), and 9 November (green). Source: US Treasury.
Today, and Eight Years Ago
Here are graphs of employment, industrial production, personal income ex.-transfers, manufacturing and trade sales, and real GDP (five indicators that the NBER Business Cycle Dating Committee has focused on in the past) depicting the state of the macroeconomy, given what we know today, and compared to eight years ago.
New data sources for economic research
One of the exciting implications for economists of the digitization of everything is the ability to study economic relations and behavior at a level of detail far beyond anything that could have been attempted a decade ago. I’ve earlier called attention here to new measures of inflation obtained from millions of prices posted on the web, new insights into pricing behavior coming from scanner data on individual store transactions, and understanding of consumer behavior based on debit and credit transactions of 25 million Americans. Here I discuss another new study based on smart-phone apps.
Continue reading