The Fed’s inflation target is 2% on PCE inflation. CPI inflation has averaged 0.5 ppts above PCE inflation since 1967. Putting these two points together, we see that expected inflation over the next five years is pretty close to target (h/t Mark Zandi).
NFP Growth of over 500K in Historical Perspective
Reader Rick Stryker writes:
It’s a good thing that Mitt Romney didn’t criticize the Biden economy by saying that we should be seeing 500K job increases, because that would have triggered another multi-year rant from Menzie that that’s IMPOSSIBLE!!!
Inflation Breakeven and Term Spreads Adjusted for Premia
Expected inflation inferred from the Treasury-TIPS spread is tainted by risk and liquidity premia. The difference between expected future short rates and current short rates is also obscured by risk premia. Here are adjusted spreads:
So You Think We’re in a Recession as of Mid-July?
Employment situation release data for July, and Weekly data and Google/big data through July 29th, on the US economy (follow up on Part I, Part II, Part III, Part IV, Part V, Part VI, as well as “So you think we might be in recession as of mid-June”, Part I and Part II) – a rejoinder to a reader’s view expressed (yesteroday!yesterday – [my mistake – MDC]) “based on the indicators I track, yes, I think we are in continuing recession, and I expect a hard reset of the economy in H2.”
CBO Assessment on a Current Recessionary Environment
From CBO:
Prediction Markets on Congressional Control
Bets on Democratic control of one or both houses of Congress now up to 63%. Big discrete move at the Dobbs decision, then gradual convergence to 50-50 on August 1st, starting in mid-July.
Heavy Truck Sales and Vehicle Miles Traveled Growth As Coincident Indicators
Calculated Risk reminds me that heavy truck sales is something that collapses during recessions. I wondered how the 12 month change in this variable compare against the corresponding change in vehicle miles traveled (suggested by Steven Kopits). The latter does pretty lousy.
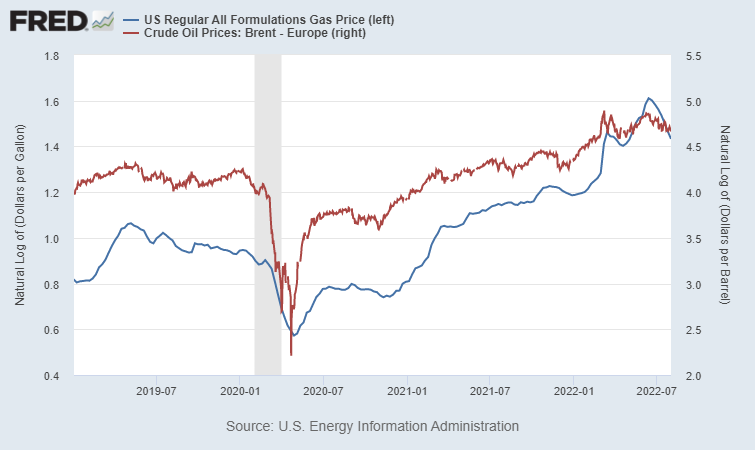
Gasoline and Oil Price, through August 1st
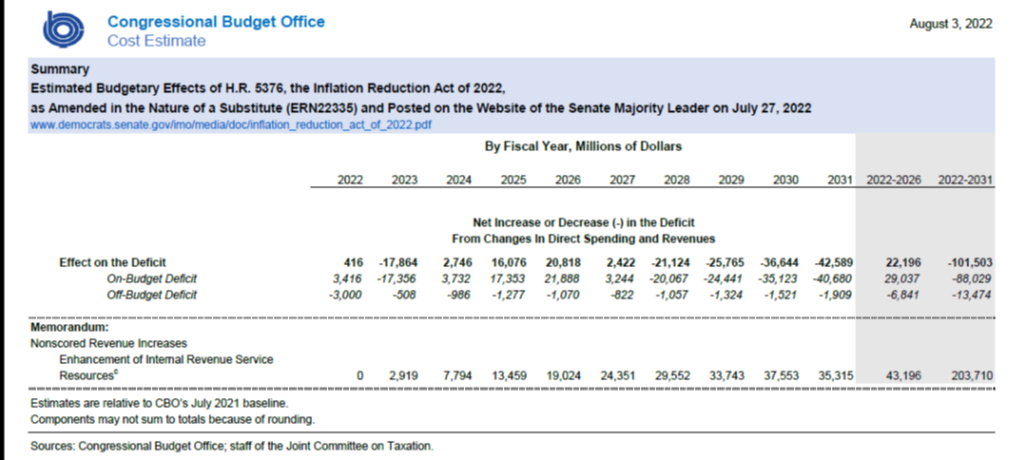
CBO Scored Inflation Reduction Act: 10 Year Deficit Reduction of $101.5 bn
Summarizing the Arguments: Recession in July?
From Goldman Sachs (A.Nathan, J.Grimberg) today:
Despite last week’s Q2 GDP release that showed growth contracting for a second consecutive quarter—tripping the rule of thumb that two quarters of negative growth constitute a recession—we don’t think the US is officially in recession. We note that the indicators that the NBER places the greatest weight on for determining monthly and quarterly business cycle peaks have all continued to increase, as gross domestic income rose in the first quarter and nonfarm payrolls have continued to grow at a rapid pace. And while labor market data has historically lagged other economic indicators, we find that it would be historically unusual for the labor market to appear as strong as it is at present even at the very outset of a recession. We see Q2 corporate financial results and management guidance as providing further evidence that the economic expansion continued during the second quarter, and also view the message from credit market fundamentals as reassuring. That said, growth has slowed substantially, and as a result we continue to expect the Fed to slow the pace of tightening from here, delivering a 50bp hike in September and 25bp hikes in November and December.

