Today, we present a guest post written by Jeffrey Frankel, Harpel Professor at Harvard’s Kennedy School of Government, and formerly a member of the White House Council of Economic Advisers. This was his response to a question posed in a symposium of views in The International Economy:
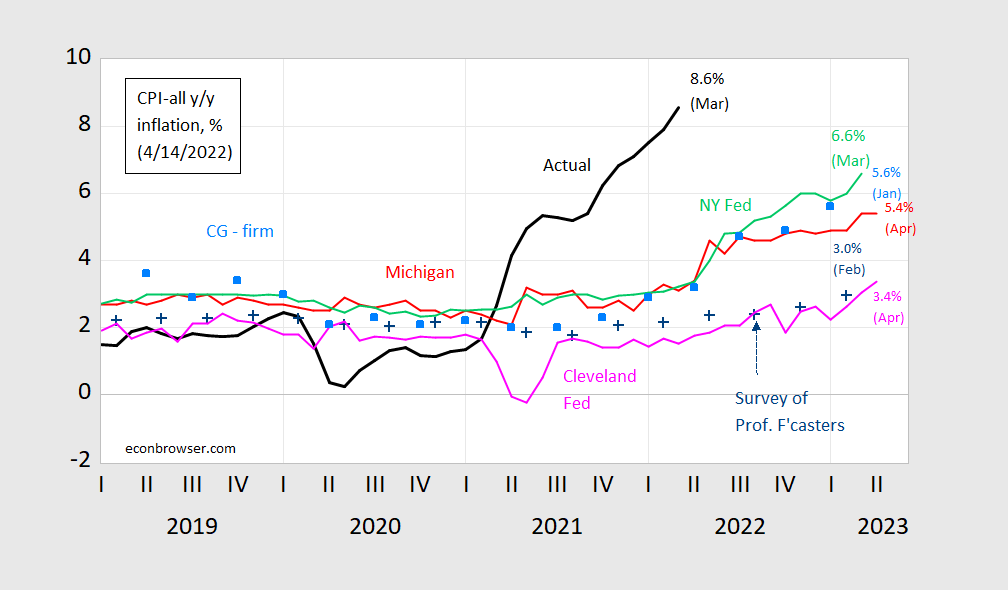
One Year Ahead Inflation Forecasts
Figure 1: CPI inflation year-on-year (black), median expected from Survey of Professional Forecasters (blue +), median expected (preliminary) from Michigan Survey of Consumers (red), median from NY Fed Survey of Consumer Expectations (light green), forecast from Cleveland Fed (pink), mean from Coibion-Gorodnichenko firm expectations survey [light blue squares]. Source: BLS, University of Michigan via FRED and Investing.com, Reuters, Philadelphia Fed Survey of Professional Forecasters, NY Fed, Cleveland Fed and Coibion and Gorodnichenko.
In terms of accuracy and bias, a new study by Bennett and Owyang (forthcoming) is very relevant.
Real Wages
Reader JohnH confidently asserts:
Will the True PPI Stand Up?
Links: Oil Shocks, China Lockdowns, Spring Meetings, Economic Report of the President, and Ukraine Reconstruction
Some links relevant to current events, in no particular order:
PPI Inflation in March, with Implications for April CPI
Month-on-month PPI inflation surprised on the upside, 1.4% vs. Bloomberg consensus 1.1%, while core PPI was up 1% vs. 0.5% consensus.
Financial Market Responses to the March CPI Release
10yr-2yr spread continues to rise, 5 year inflation breakeven (unadjusted) shrinks, as does implied 2 month interest rate 1 month forward.
Inflation and Energy Prices
It’s belaboring the obvious that gasoline (and energy prices) had a big impact on headline inflation [BLS release]. M/m inflation was at Bloomberg consensus of 1.2%, while core was below, at 0.3% vs. consensus 0.5%. However, it’s useful to see how over time exactly how much headline and core diverged.
Statements and Documentation on Russian Actions in Ukraine
From Human Rights Watch (Apr 3): “Ukraine: Apparent War Crimes in Russia-Controlled Areas: Summary Executions, Other Grave Abuses by Russian Forces”.
From Amnesty International (Apr 7): “Ukraine: Russian forces extrajudicially executing civilians in apparent war crimes – new testimony”
From UN Human Rights Monitoring Mission in Ukraine (HRMMU) (March 28): “Mounting civilian deaths, mass destruction and catastrophic humanitarian situation as Russian Federation attacks Ukraine”
Bellingcat has been documenting the application of cluster bombs and artillery strikes against civilian populations.
Gasoline Prices – Looking Forward
Nowcasts for tomorrow’s CPI print is 1.1% m/m (Cleveland Fed), and Bloomberg consensus is 1.2%. In contrast, core CPI nowcast is 0.52%, consensus at 0.5%. The large gap is in large part attributable to gasoline prices, which rose 20% in March (all grades), even though the CPI weight of gasoline is only 3.8%. What do gasoline prices look like in April? This will depend on oil prices.
