Confidence Intervals
Guest Contribution: “Is China’s growth rate negative?”
Today, we are pleased to present a guest contribution written by John G. Fernald, Jack Mueller, and Mark M. Spiegel (all of the Federal Reserve Bank of San Francisco). Our views are our own, and not necessarily those of the Federal Board of Governors or the Federal Reserve Bank of San Francisco.
Gasoline Prices Now… and Standard Errors
Reader rsm is perpetually concerned about the precision of economic data, most recently here in re: gasoline prices.
Why am I paying 12-15% more than the graph? What possible reason do you have for not including standard errors? Would error bars stop you from making all these claims about noise?
Below is the price of regular gasoline, plus/minus 1.96 standard errors.
Gasoline Prices Now
Are declining as of the beginning of this week:
Five Year Expected Inflation Now, Five Years from Now
From the markets:
How Much of the Trade Deficit Is Government Spending Induced?
Some of it – but some indications are that it’s not the majority.
As the Nation Approaches 800,000 Covid Fatalities [updated graph]
Commenter Rick Stryker wrote confidently on August 20, 2020:
If I’m right, then we’d get a total death toll of 368K.
As of the 12/13/2021 CDC release of officially tabulated Covid-19 fatalities, cumulative fatalities through the week ending 11/27 were 793.834, somewhat exceeding 368,000.
[updated 12/16, 10:30am Pacific] Here is a graph to depict what this “forecasting miss” looks like:
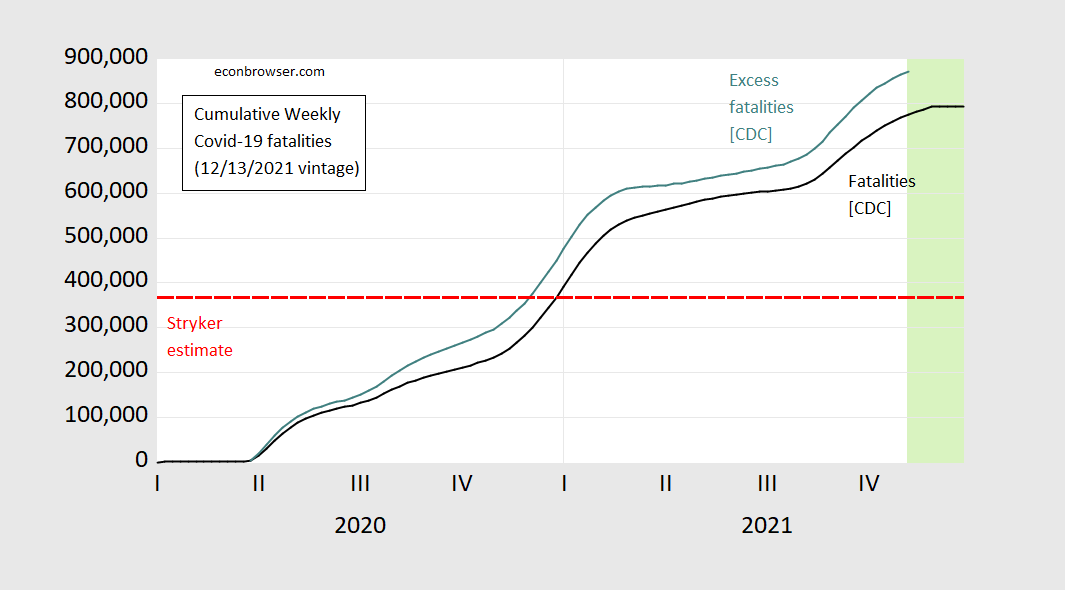
Figure 0: Cumulative weekly fatalities due to Covid-19 as reported to CDC for weeks ending on indicated dates (black), cumulative excess fatalities calculated as actual minus expected (teal). Note excess fatalities equals zero for early observations where expected exceeds actual. Light green shading denotes CDC data that are likely to be revised. Source: CDC 12/13/2021 vintage, and author’s calculations.
What Happens When One Runs Around Saying Things without a Model
Steven Kopits writes:
We might expect a massive stimulus coupled with a major loss of jobs to lead to an explosion of the trade deficit, which it has.
…
In extremis, such a stimulus might even generate record levels of goods imports, which it has.
…
This record level of imports would result in record levels of shipping, which it has, with LA in-bound port traffic running about 15% above its prior peak. (Let me add here that US shale oil production has meant that the historical US trade deficit in oil has disappeared. Since oil is imported chiefly through Houston and a couple of other ports — but not LA — the increase in port traffic is showing up in merchandise, not oil, imports. That is, imports are going to cargo ports like Long Beach and LA.) Such ports may not be equipped to handle surges of cargo imports well above historical peaks.
…
At the same time, a loss of jobs accompanied by record stimulus might lead to weak exports, which it has.
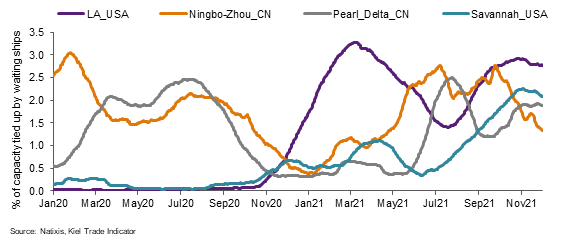
The Ports Tie-Up, Illustrated
From Natixis: