Today, we present a guest post written by Jeffrey Frankel, Harpel Professor at Harvard’s Kennedy School of Government, and formerly a member of the White House Council of Economic Advisers. A shorter version appeared on October 25th in Project Syndicate.
Recession Watch, October 2016
The 2016Q3 GDP advance figures were released today, indicating a 2.9% growth rate (SAAR), exceeding consensus (Bloomberg 2.5%). Tomorrow, Jim will report on the recession probabilities based upon the advance release (see last quarter’s analysis here). Until then, given all the discussion of recession (e.g. [0], [1]), it seems useful to show a few pictures of where we stand today, and the outlook going forward, given some standard and non-standard indicators.
ALEC Rankings vs. Performance: Minnesota vs. Wisconsin Edition
In case you were wondering, Minnesota continues to outpace Wisconsin.
The Kansas Economy: Three Pictures
The Philadelphia Fed released coincident indices today. Figure 1 shows state-by-state 3 month trends. Needless to say, the outlook for Kansas — that laboratory for supply side nostrums — is not auspicious.
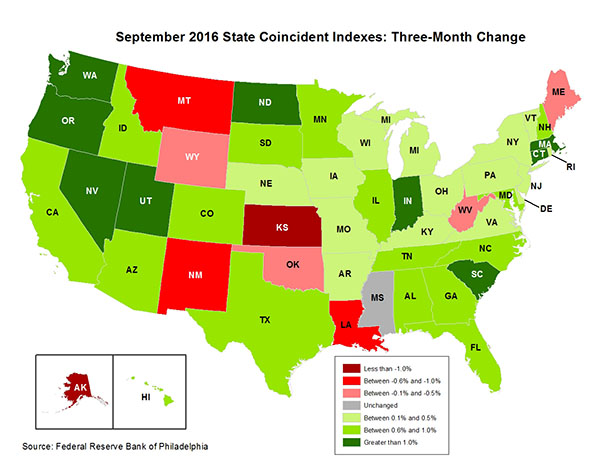
Source: Philadelphia Fed, accessed 26 Oct 2016.
While Alaska seems to be in the running for worst performing, in fact the 3 month (annualized) decline of 4.5% for Kansas is the worst in the 50 states.
“Gaining Currency: The Rise of the Renminbi”
That’s the title of a newly released book written by Eswar Prasad, an authority on the Chinese economy (and international finance).
More on the Kansas Employment Collapse
Brad DeLong reminds me of how badly Kansas is doing, when viewed from a longer perspective.
Kansas and Missouri: Diverging Employment Fortunes
September employment figures confirm that the Kansas economy continues its decline, while Missouri continues to expand.
Wisconsin Nonfarm Payroll Employment Falls
Minnesota, US series continue to rise.
The Mexican Peso and Prediction Markets
I was talking about prediction markets and asset prices (the Mexican peso and the Presidential election, and the pound and Brexit) in my classes this week. It struck me a good time to update this post on the peso’s movements as the odds for a Democratic win change.
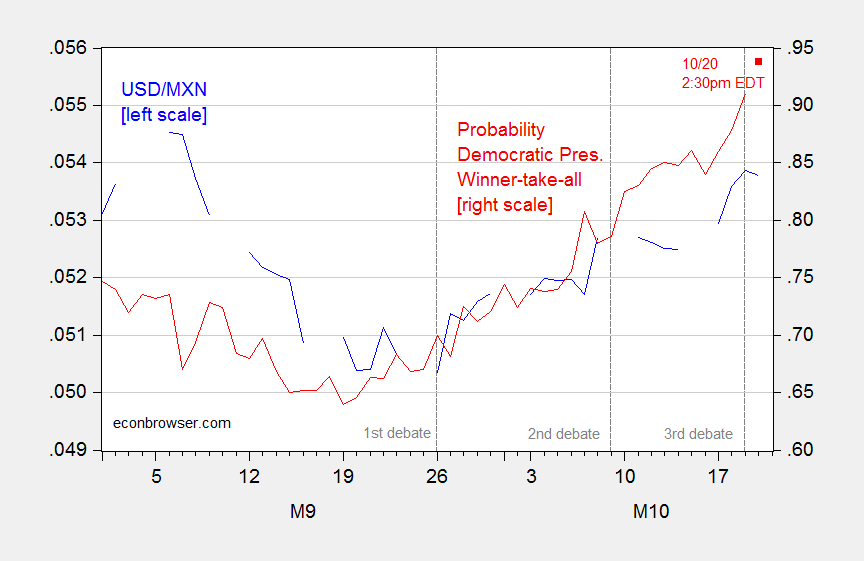
Figure 1: USD/MXN exchange rate (blue), and odds of Democratic win in Presidential election, end of day (red). Observation for 10/20/2016 is as of 2:30PM Eastern time. Exchange rate defined so up is MXN appreciation. Source: FRED, Pacific Exchange Services, and Iowa Election Markets.
The adjusted R2 of a bivariate regression of first differences regression (exchange rate in logs) is 0.08, pretty good on a high frequency time series, in my book (t-stat with HAC robust errors is 2.06).
Global Temperature Anomaly, Through September

Source: NOAA
The highest point estimate for the anomaly is for 2016. For 2014, the 95% interval is ±0.09°C [1]. If that is ballpark for the 9 months estimate, then one can’t say that 2016 is hotter than 2015 (with statistical significance at the 5% msl), but can say it is hotter than 1998, a year often focused on by the “hiatus”-ers.
Update, 5:08PM Pacific: Here is a trailing 60 month moving average, ending observation for September 2016.
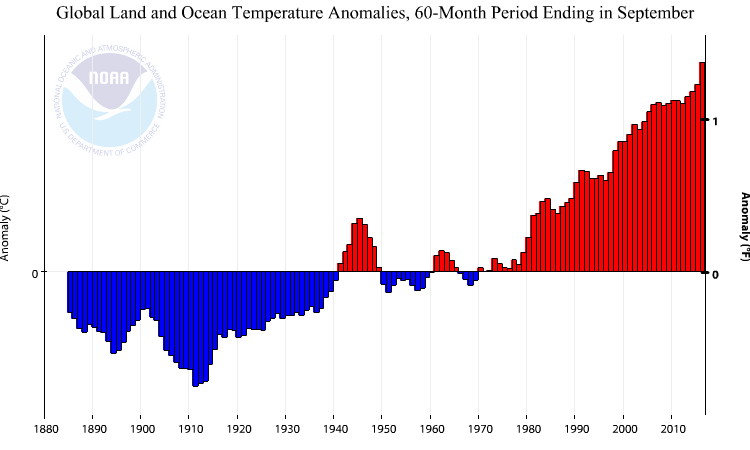
Source: NOAA