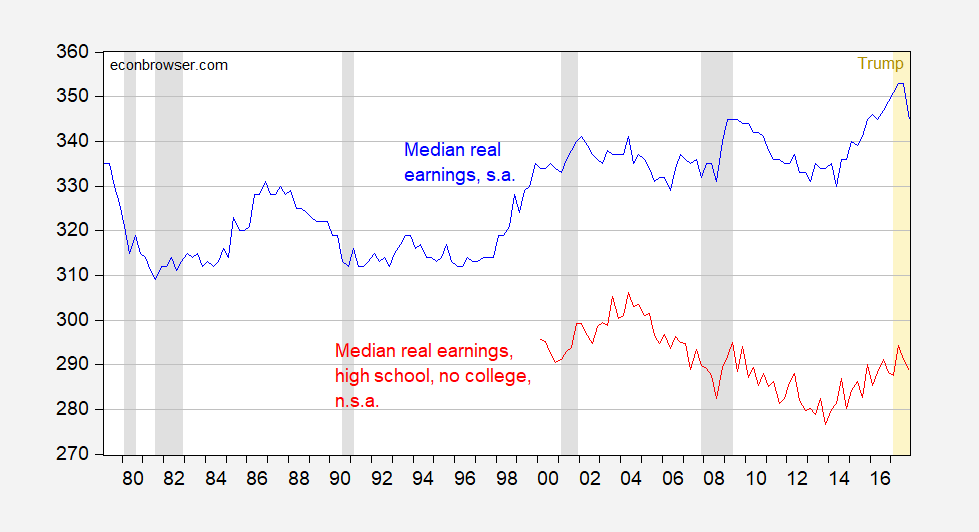
Figure 1: Employed full time: Median usual weekly real earnings for Wage and salary workers, 16 years and over, 1982-84 CPI Adjusted Dollars, seasonally adjusted (blue), and Employed full time: Median usual weekly nominal earnings (second quartile)f or Wage and salary workers, High School graduates, no college, 25 years and over, seasonally adjusted, deflated by CPI, not seasonally adjusted (red). NBER defined recession dates shaded gray. Orange shading denotes Trump administration. Source: BLS via FRED, and author’s calculations. (updated 8:30PM Pacific)
Farm Sector Prices and Income under Mr. Trump
So far, so-so.
The U.S. economy keeps growing
The Bureau of Economic Analysis announced today that U.S. real GDP grew at a 2.6% annual rate in the fourth quarter. That is better than the 2.2% we’ve seen on average since the Great Recession ended in 2009, though below the historical average growth rate for the U.S. economy of 3.1%.
Wisconsin GDP since Walker
Here are GDP series for Wisconsin, as compared to Minnesota and the Nation, normalized to 2011Q1 when Governor Walker took office. I’ve indicated the implementation of the Manufacturing and Agriculture Credit, and percentages, as well.
Tax Preferences for Manufacturing and Manufacturing Value Added in Wisconsin
State level data for GDP in 2017Q3 were released yesterday. This is an opportunity to evaluate the progress of manufacturing value added (as opposed to employment) in Wisconsin after passage of the Manufacturing and Agriculture Credit (MAC).
California in Recession? (Part II)
The release of labor market indicators suggests not, contra some recent commentary.
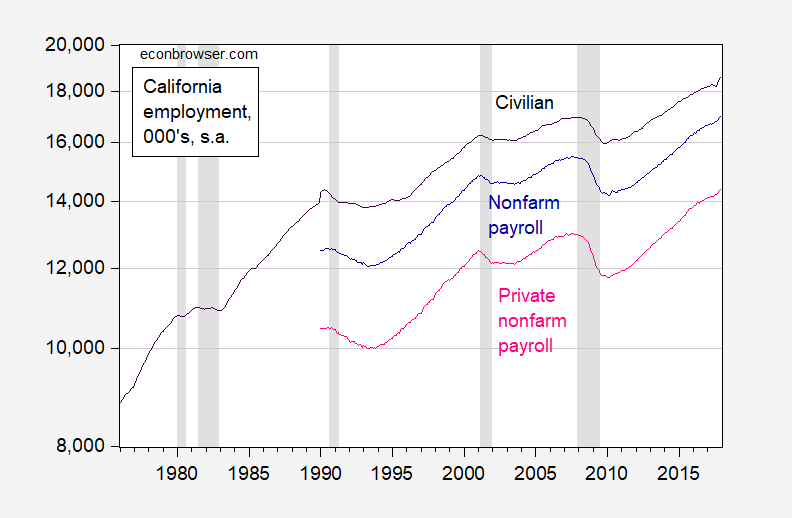
Figure 1: California civilian employment over age 16 from household survey (black), nonfarm payroll employment (dark blue), private nonfarm payroll employment (pink) from establishment survey, all in thousands, seasonally adjusted, on log scale. NBER defined recession dates shaded gray. Source: BLS and NBER.
Continue reading
Guest Contribution: “Three Candidates for Fed Vice-Chair”
Today, we present a guest post written by Jeffrey Frankel, Harpel Professor at Harvard’s Kennedy School of Government, and formerly a member of the White House Council of Economic Advisers.
World Economic Outlook Update: Upwardly Revised Growth, Rising Risks?
The IMF released an update to WEO today:
Continue reading
Guest Contribution: “Trump’s Tax Cut Will Worsen the US Current Account Deficit”
Today, we present a guest post written by Jeffrey Frankel, Harpel Professor at Harvard’s Kennedy School of Government, and formerly a member of the White House Council of Economic Advisers. This is an extended version of a column that appeared at Project Syndicate on January 15th.
Wisconsin Nonfarm Employment Flat
Today, the DWD released statistics for December here. Total nonfarm payroll declined slightly, private increased slightly. The cumulative gap with respect to Minnesota (and the US) widened in both cases.
Continue reading