With apologies to Seinfeld. It seems like a long time ago that conservatives argued for cutting taxes and cutting spending so as to spur expansion — but the Brownback and Walker experiments in Kansas and Wisconsin are in some sense just being completed now, some five years after Governor Brownback’s “shot of adrenaline” forecast.
Trump’s Trade Deficit
A progress report (the deficit is increasing, if you were wondering…)
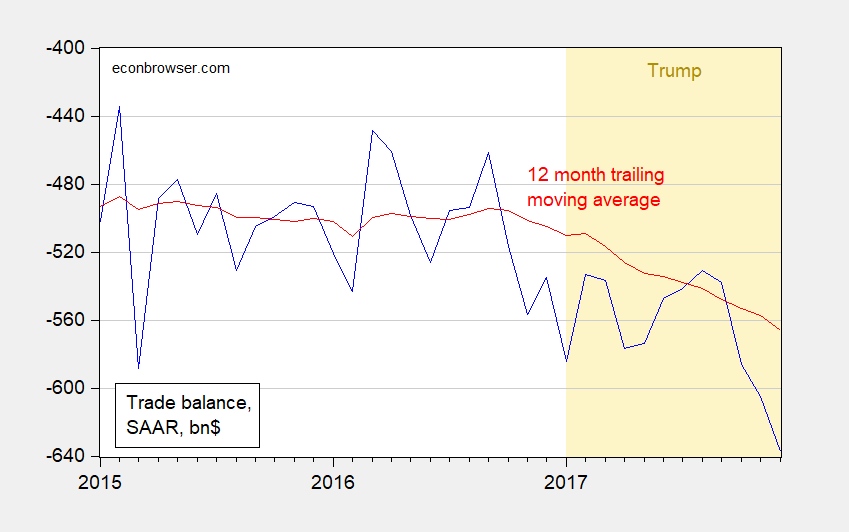
Figure 1: Trade balance in billions of dollars, SAAR (blue), and 12 month moving average (red). Orange denotes Trump administration. Source: BEA/Census December trade release, and FRED.
More on Portfolio Crowding Out in the Context of Normalized Fed Policy
The algebra and graphical analysis (from my undergrad course) is here. If you don’t understand it, don’t bother commenting.
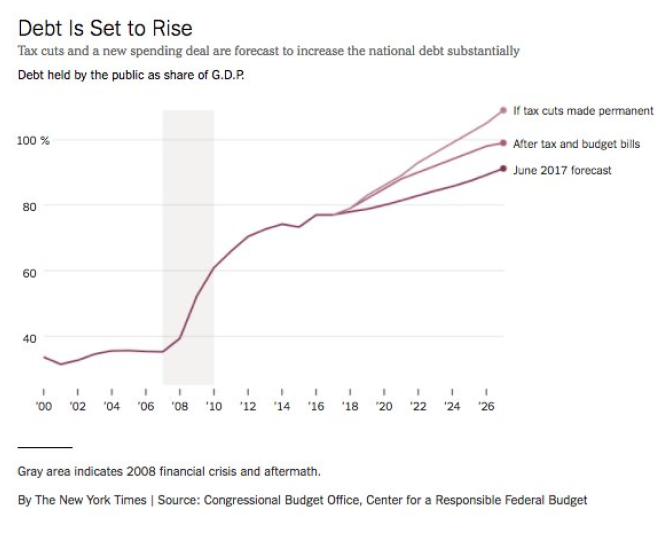
Source: Irwin, NYT, 9 Feb 2018.
A Fisherian Decomposition of the Recent Interest Rate Increase
How much of the increase in the 10 year constant maturity Treasury yield is from higher real rates, and from higher expected inflation?
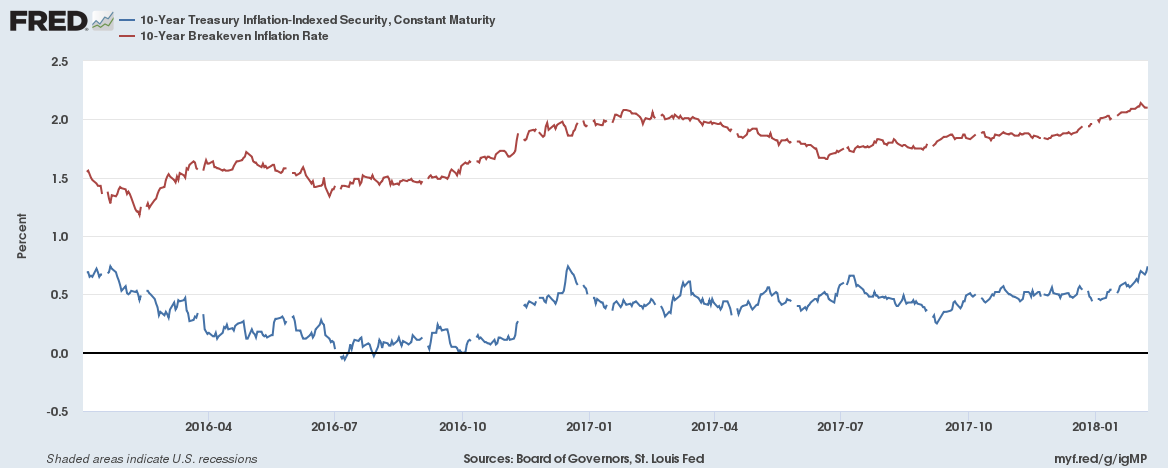
Source: Federal Reserve Board via FRED.
Recalling the Fisherian identity:
it = rt + πet
One can take the total differential:
Δit = Δrt + Δπet
Hence, of the 0.49 percentage point change from December 15 to February 7 in ten year Treasury yields, 0.27 percentage points is accounted for by a real interest rate increase, and 0.22 percentage point by inflation expectations boost (abstracting from liquidity premia, etc.).
Over the five year horizon, of the 0.41 percentage point change, 0.28 percentage points is accounted for by the real rate change, and 0.21 percentage point from higher expected inflation.
All about why nominal rates are rising, in interview with Marketplace (Stan Collender comments too). We talk about the standard things — tax cuts, spending increases, Fed QE unwinding and rate increases, and (my contribution) the deceleration of foreign central bank Treasury purchases (graphical depiction here on page 6). Discussion of the last point with respect to China here.
US Treasury Bond Demand Is Infinitely Elastic with Respect to Wealth? “Mnuchin Says $1 Trillion U.S. Debt Plan Isn’t Affecting Markets”
From Bloomberg:
“I don’t think that’s had an impact on the market at the moment,” Mnuchin told reporters at the Capitol on Tuesday. “The debt markets are one of the most liquid markets in the world and are reacting very well.”
California in Recession? (Part III)
Back in mid-December, Political Calculations asked if California was in recession. Data released by the Philadelphia Fed suggests the answer is no.
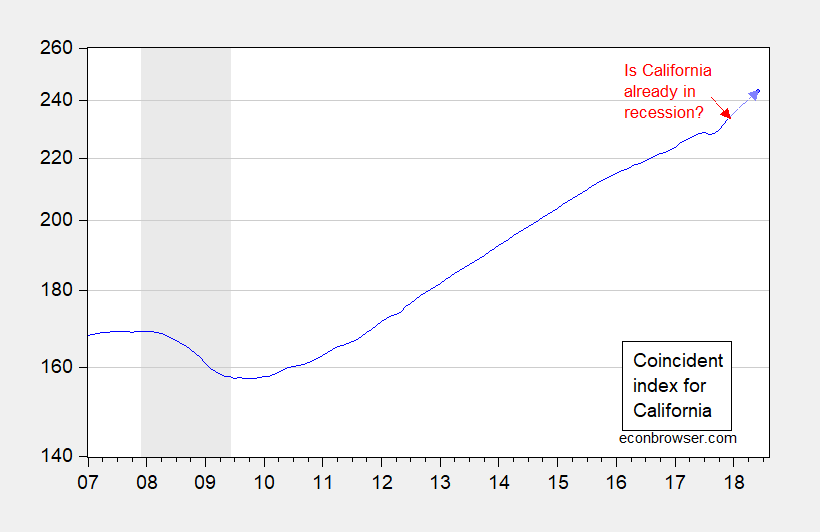
Figure 1: Coincident index for California (blue), and implied index value for June 2018 using leading index (light blue arrow, blue dot) against log scale. NBER defined national recession dates shaded gray. Red arrow at date of Political Calculations post. Source: Philadelphia Fed [1], [2], and author’s calculations.
Janet Yellen: A True Public Servant
Janet Yellen ended her term as Chair of the Federal Reserve today.
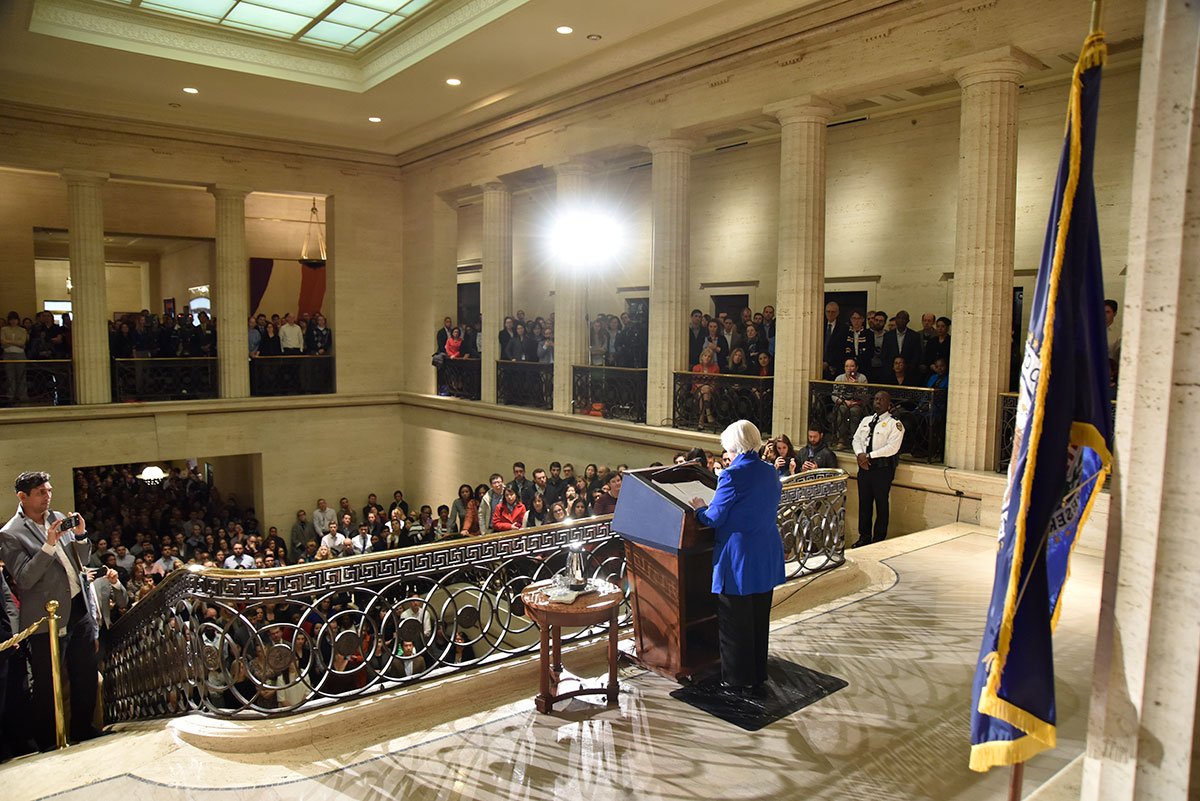
Source: Federal Reserve
Continue reading
EconoFact: “Threats to U.S. Agriculture from U.S. Trade Policies”
Or, Does Mr. Trump feel lucky?
From EconoFact:
The agriculture sector in the United States depends upon exports for its vitality. Sales of U.S. agricultural products abroad are responsible for 20 percent of U.S. farm income, supporting more than one million American jobs on and off the farm, according to the U.S. Department of Agriculture. The three biggest buyers of American agricultural products are China, Canada, and Mexico. Yet trade with these three countries faces heightened uncertainty. The Trump Administration initiated a process of renegotiating the North American Free Trade Agreement (NAFTA) with Canada and Mexico, which includes the option of exiting the deal altogether. In addition, the United States has started a series of investigations of unfair practices leveled against China, some of which have already resulted in the imposition of new tariffs. These trade policy initiatives threaten agricultural exports both because of the potential increase of tariffs on exports to Canada and Mexico that would result from a withdrawal from NAFTA as well as the very real threat of retaliation in response to other proposed policies.
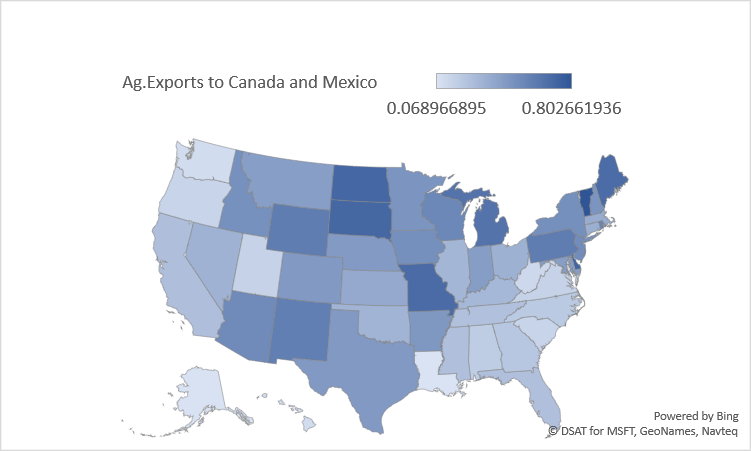
Figure 1: Share of total agricultural exports going to Mexico and Canada, by state. Agricultural exports defined as NAICS 111+112+311 (crops, livestock, and processed food). Source: Census via ITA and author’s calculations.
The entire article is here. More on agricultural sector fortunes here.
If NFP Employment Growth Had Grown in 2017 (and January 2018) Like It Did in 2016
we’d have had over 340,000 more jobs in December. And over 380,000 more jobs in January
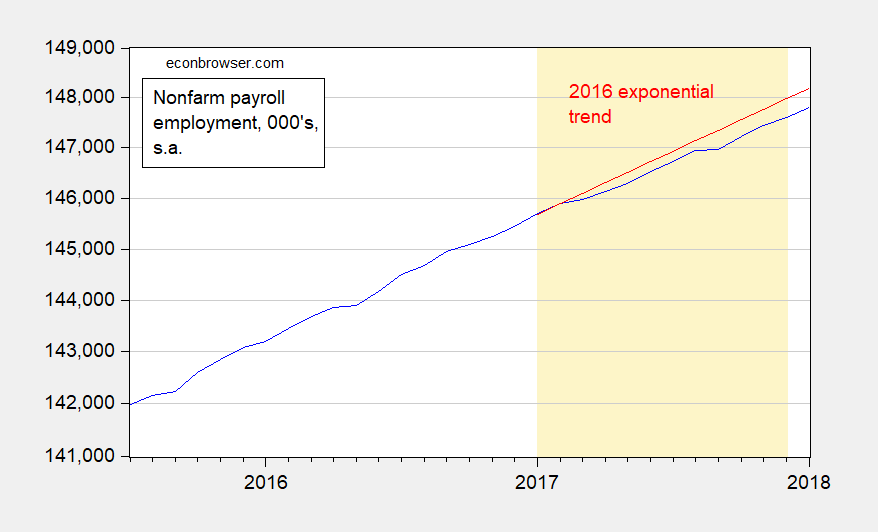
Figure 1: Nonfarm payroll employment (blue), and 2016 linear deterministic exponential trend set to match 2017M01 value (red), in 000’s, seasonally adjusted, on log scale. Orange shading denotes 2017 data. Source: BLS December 2017 January 2018 release, author’s calculations. (updated 2/2)
Kansas GDP and Employment under Brownback: A Retrospective
Now that Brownback is an ex-governor, and the tax plan he touted as a “shot of adrenaline” is largely reversed, it’s a good time to see what damage was wrought.