From JohnH on 9/2/2022, in response to anonymous’s query: “how’s the crossing of the dneipr and reconquesta of kherson going?”
Natixis: Impact on Chinese GDP Growth via Consumption Reduction
Garcia-Herrero and Xu, “China’s Covid Restrictions May Slash More than Two Percentage Points of Growth in 2022,” (Natixis, Sep 27, 2022):
[Assuming] Covid-related mobility restrictions in 03 to remain similar for 04, the overall reduction in China’s GDP growth in 2022 could be 2.3 percentage points.
Guest Contribution: “Has the Fed Pivoted Too Far?”
Today, we present a guest post written by David Papell and Ruxandra Prodan, Professor and Instructional Associate Professor of Economics at the University of Houston.
Weekly Economic Activity through 9/24
As measured by NY Fed WEI, OECD Weekly Tracker, and Baumeister, Leiva-Leon and Sims WECI.
GDP Level Up, GDO Down and Trending Sideways
The annual benchmark revision (release) made substantial changes to the level of reported GDP — but not to the growth rate in 2022H1– while GDO is revised slightly down as GDI is revised downward. Final sales to private domestic purchasers, a measure of domestic demand, revised up and rises.
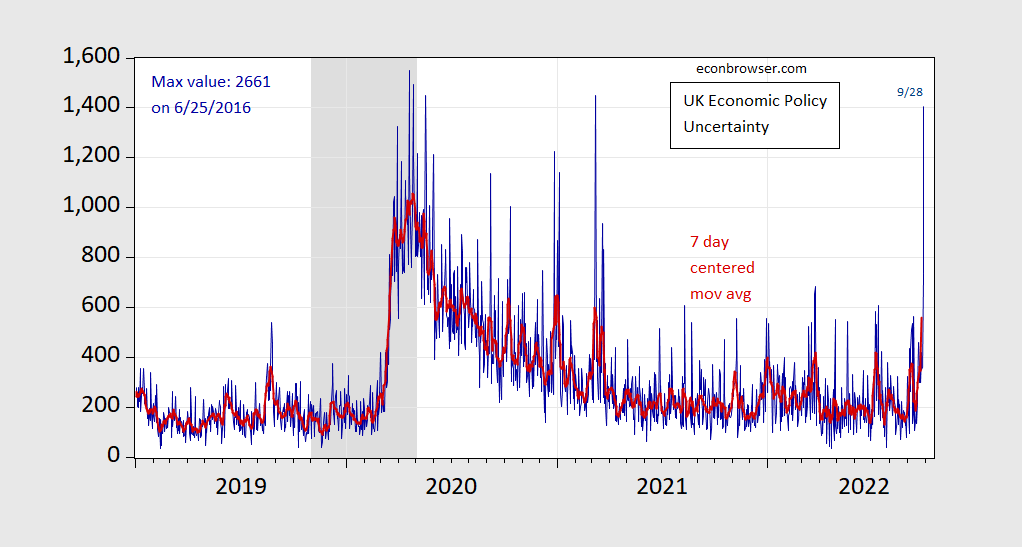
UK Economic Policy Uncertainty Spikes
As I wrote yesterday, “tomorrow is another day”.
Figure 1: UK Economic Policy Uncertainty (blue), and centered 7 day moving average (red). ECRI defined recession dates shaded gray. Source: policyuncertainty.com, ECRI and author’s calculations.
UK Measured Economic Policy Uncertainty in Context
In some ways, policy uncertainty — at least as measured using text — is not as bad as I would’ve thought. Here’s the Baker-Bloom-Davis index:
Yield Curve Inversions in the UK
Recession coming? Or is it already here? Here’s a picture of the UK yield curve as of today, a month ago and 6 months ago:
Reserve Currency Status Is No Vaccination against Recklessness – UK Edition
…although it helps.
I never thought an advanced economy government could pursue stupider policies than that implemented under the Trump administration. Consider me corrected on this point – case in point, the United Kingdom in 2022.
Q3 Growth vs. Benchmark Revisions
Lackluster growth is nowcasted for Q3 by Atlanta Fed (0.3% SAAR), somewhat faster by Goldman Sachs (1.2%). It’s important to remember that the impact on the implied level of GDP might be dwarfed by the annual benchmark revision. And for the first time, the annual benchmark revision will come September 29th, rather than the end of July.
