Slight bump up in March/April expectations, but still down relative to mid-2022.
Foreign Term Spread Augmented Recession Model Prediction
About 83% probabiity within a year: Here’s the edited version of Table 3 of Ahmed-Chinn (2022), plugging in March 31, 2023 values (in red), which I prsented in a UW Milwaukee Department of Economics seminar today (thanks to my gracious hosts, who provided tons of great comments/criticisms).
CPI, PPI, and PCE Instantaneous Inflation
Based on Eeckhout, using a=4, T=12:
Business Cycle Indicators, mid-April
Event: “Managing the U.S.-China Trade and Technology Conflict: Is There a Better Way?”
A CMU-UW Madison-Columbia U-Rand zoom event on “Managing the US-China Trade and Technology Conflict: Is There a Better Way?” (April 17th) with experts (some of whom are coauthors, colleagues, and friends of mine).
CPI Inflation in March: Downward, Month-on-Month
While year-on-year core rose, month-on-month fell, along with other measures of inflation that are aimed at getting the trend.
Guest Contribution: “In god we trust, all the others must bring (good) collateral”
Today, we are pleased to present a guest contribution by Miklos Vari (Banque de France). The views expressed herein are those of the author and should not be attributed to the Banque de France or the Eurosystem.
More on Cost-Push Shocks and Inflation Expectations in a Phillips Curve Context
Gianluca Benigno notes that the NY Fed’s GSCPI, used in this post on using a naive expectations augmented Phillips curve to predict inflation, can be used independently to predict inflation, as in Akinci, et al. “How much can GSCPI improvement help reduce inflation” (Feb 2023).
How Well Do Adaptive Inflation Expectations Do, 1982-2023?
Answer: so-so.
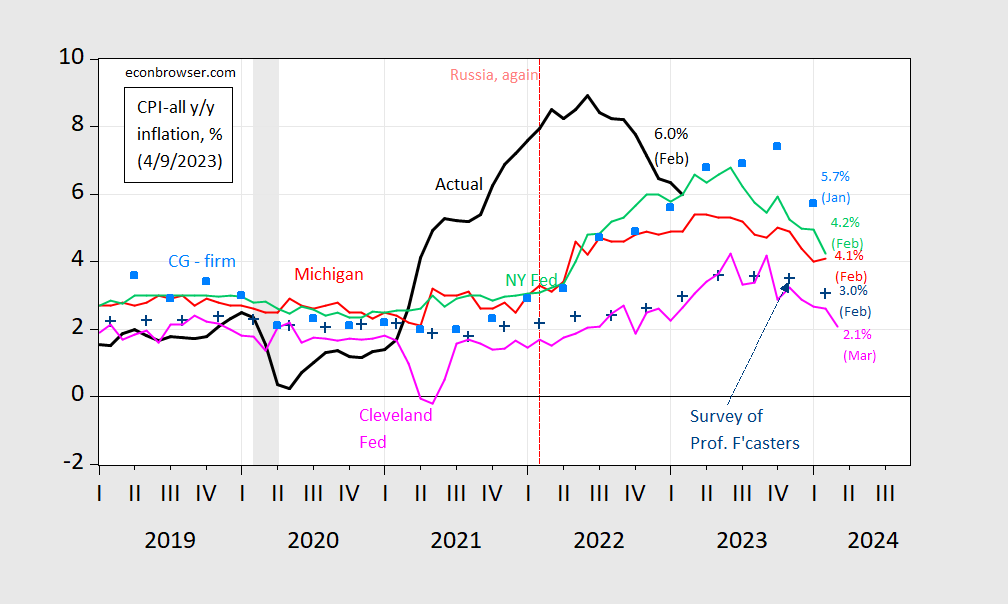
Reader Erik Poole commenting on this figure (in this post) writes:
Assuming that the all the inflation forecasts are one-year forecasts in the above chart, do we have any kind of inflation expectations data for shorter time frames, such as 6 months?
The above is a fancy way of asking: are financial markets and professional forecastersb really that bad at forecasting inflation?
Glancing at the above chart, it appears to make a good argument for adaptive expectations driving economic agents inflation expectations.