That’s former CEA Chair Miran’s argument in the FT. Is this assertion empirically validated? A graph from Hamilton, Harris, Hatzius and West (2016) suggests, maybe not:
Petroleum and Petroleum Product Prices
Data through 9/7 from the EIA:
Interesting Word of the Day: Carousel
For the first couple of months of my stint on the CEA staff back in 2000, I had to cover trade issues (my designated area was international finance). One of the first words I learned walking into the EEOB/OEOB– that I hadn’t heard of in my grad school classes — was “Carousel Retaliation”.
From CRS:
Wisconsin Dairy Hit With Retaliatory Tariffs:
From Wisconsin Cheese Makers Association:
On August 25, Canada announced a broad set of retaliatory tariffs, hitting U.S. dairy hard. Our northern neighbor announced that as of September 8, U.S. cheese entering Canada will face a 25 percent tariff, while milk products, cream, and whey products will see a 50 percent tariff.
The Marginal Efficiency of Investment Equation Interpreted in 2024-26

Policy Uncertainty: Economic and Trade
Through yesterday:
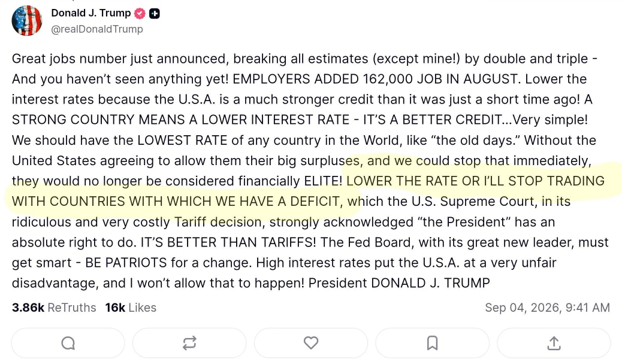
Who Will We Trade With If the Fed Doesn’t Lower Rates?
The Blackest Black Box Mid-Session Review Ever
I was looking to see what the Administration’s Mid-Session Review economic forecast looked like. Alas, courtesy of Jared Bernstein, I am disappointed. Did Vought et al. purge all the economists from the CEA, Treasury and OMB? The MSR:
August Real Average Hourly Earnings Nowcasted
With August hourly earnings and nowcasted August CPI:
Business Cycle Indicators: CES/CPS Employment Surges
Evidence of continued growth: