The forecasted price level (CPI) has been moved up, as near term expected inflation has increased. Near term GDP growth forecasts upwardly revised, but downside risks remain. Projected output gap small positive at year’s end.
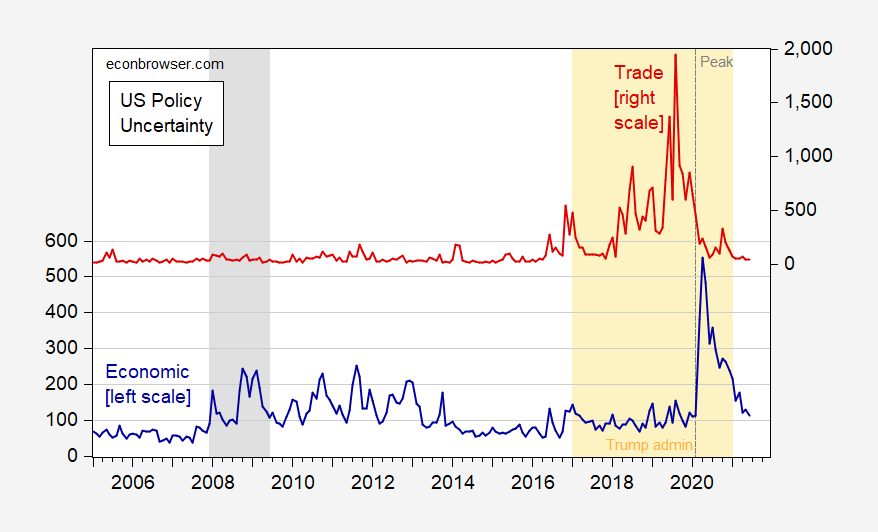
Policy Uncertainty Six Months, A.T.*
* “After Trump” .
Figure 1: US Economic Policy Uncertainty index (news) (blue, left scale), US Trade Policy Uncertainty categorical index (red, right scale), both monthly averages of daily data. NBER defined recession dates shaded gray, NBER peak at dashed line; orange denotes Trump administration. Source: policyuncertainty.com, and NBER.
Part of this decline in uncertainty could be attributable to the economic management team.
Rashomon on E Street, SW
Regarding a report released by the International Trade Commission, The Coalition for a Prosperous America – a pro-protection organization led by a former Nucor CEO/Chairman – notes Government Study Shows Free Trade Deals Produced Little Benefit Except for Multinationals :
Macroeconomic Management in the Biden Administration
Here is an update to this post, on who’s where at the top of select agencies.
Baumeister, Leiva-León, and Sims: “Tracking Weekly State-Level Economic Conditions”
Ordinary People vs. Economists on the CPI Level
Pretty big spread in views, illustrated:
Section 232 Report on Automobiles Released (over 2 years after submission to Trump)
Inflation Expectations – 5 Year Horizon
From Bloomberg today, “The Great Reflation Trade Is Buckling All Across Wall Street”:
More Great Quotes from the Past
From a reader in 2018:
The people 2slugs disdains can overhaul an engine and cultivate a field way better than 2slugs, and have way more “common sense” than many university professors. The supposed nincompoop Trump voters in his 2 years have lead a national economic performance that Obama in his 8 years, lead by “elites” such as 2slugbaits, never did, and in fact said was impossible. Who is the expert here?
In 2017Q1-20Q1, GDP growth averaged 1.9%, and in Obama’s second term averaged 2.4%. (In Trump’s first two years, GDP growth averaged 2.6%. To be clear, what mainstream economists said was impossible was the 4% or 5% growth Trump promised.
Guest Contribution: “How far to full employment?”
Today, we are fortunate to present a guest contribution written by Paweł Skrzypczyński, economist at the National Bank of Poland. The views expressed herein are those of the author and should not be attributed to the National Bank of Poland.
