Today we are fortunate to present a contribution written by Andrew Reschovsky, Professor Emeritus of Public Affairs and Applied Economics at the University of Wisconsin-Madison.
No V for Thee (i.e., we’re not going to get 49% SAAR)
From Reuters:
“I think the economy is on a self-sustaining recovery and it’s a V-shaped recovery.”
Contemplating the (No Deal) Cliff
The recovery package cliff, that is. DeutscheBank research outlines what they think is likely (baseline) and what a no-deal means for disposable personal income.
Howlers
Some people say the craziest things:
July Wisconsin Employment Report Released
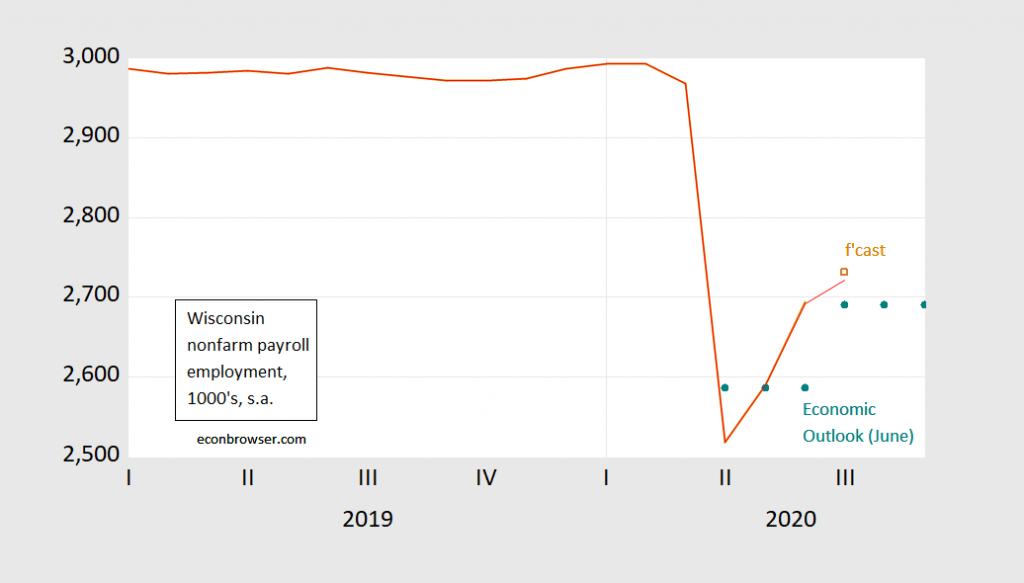
Figure 1: Nonfarm payroll employment in Wisconsin, June release (brown), July release (pink), Economic Outlook forecast of June (teal), author’s forecast based on national employment (brown box), in 000’s, s.a. Source: BLS, DWD, Wisconsin Economic Outlook (June 2020), and author’s calculations.
July Wisconsin Employment
DWD will release July numbers tomorrow. Here’s my guess for employment. First, what we know now.
Why Do We Care about Retail Sales?
In these times? Among other reasons, it’s: (1) An indicator of household consumption behavior; (2) An indicator of conditions for business – including small/medium size enterprises. Hence, the recovery of retail sales has been much lauded. But if you thought the recovery was in brick-and-mortar retailers, you’d be somewhat misguided.
Mendacity Watch: Covid-19 Fatality Rate and the Swedish Success
Reader CoRev, commenting on estimates of US Covid-19 fatality numbers, writes:
There are a growing number of reports citing Sweden’s success: https://thefederalist.com/2020/08/10/new-study-finds-swedens-refusal-to-lock-down-saved-the-economy-without-sacrificing-lives/
Covid-19 Fatalities, Excess Fatalities and Likely Revisions
From CDC and the Atlantic/Covid Tracking Project.
The Outlook: Ivory Tower vs. Wall Street
The Survey of Professional Forecasters’ Q3 forecast came out today, the Wall Street Journal August survey yesterday, and the IGM/Fivethirtyeight Covid-19 panel a few days ago. Here’s an opportunity to compare and contrast perspectives – as shown in Figure 1.
