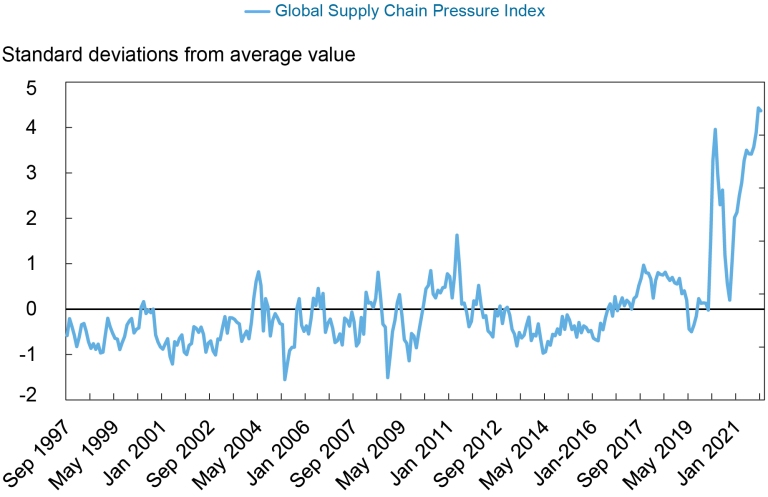
One reason why inflation exceeded my estimates from earlier this year is the price of imports. Since 2020M02, goods import prices from China have risen 5.3%, after declining 5.8% over the preceding six years. The dollar depreciated by 9.4% over the same period, implying a exchange rate pass-through coefficient of 0.56.
Business Cycle Indicators as of Mid-January 2022
Industrial production comes in below consensus (-0.1% vs. Bloomberg +0.3% m/m). Here are some key indicators followed by the NBER BCDC.
Market Responses to the CPI: Inflation Breakeven, Term Spread, Dollar
The CPI surprised on the upside by 10 bps relative to Bloomberg consensus (also higher vs. Cleveland Fed nowcasts). How did financial markets respond?
CPI Inflation in December
Beware the headlines — month-on-month inflation is (again) down, even if up year-on-year. Trimmed and chained CPI price inflation are also down, while sticky price inflation was flat. Headline and core CPI did surprise on the upside though (m/m, 10 bps over Bloomberg consensus).
Do Exchange Rate Movements Equalize Yields?
Fama (JME, 1984), and Tryon (1979) demonstrated that changes in the exchange rate do not equal the forward premium, in what came to be known as the forward premium puzzle. Since the forward premium equals the interest differential in the absence of current and incipient capital controls and in the absence of default risk — this finding is equivalent to the result that interest rates, after accounting for exchange rate changes, are not equalized on average.
In other words, if the yield on the US default-risk-free bond is 2% and the yield on a UK default-risk-free bond is 5%, then the US dollar does not on average appreciate by 3% against the pound in order to equalize returns. This finding could be explained, for instance, by the presence of a time-varying exchange risk premium on pound sterling assets (vs. dollar assets); however, it’s not been easy to find robust evidence of determinants of such a time varying premium.
While this puzzle has largely persisted in the ensuing 25 years, it seemingly disappeared during and after the global financial crisis — until re-appearing in recent years.
Sectoral Divergences and Real Wages
With yesterday’s employment situation release (discussed in this post), we have data employment by sectors, as well as corresponding average hourly earnings. We don’t have the CPI for that month, but using nowcasts, we can guess what is likely to be happening to real wages.
December Employment
Yesterday’s nonfarm payroll employment growth (here) surprised (significantly) on the downside.
Financial Market Indicators for Expected Inflation, Output
As of yesterday:
ADP Private Employment Upside Surprise
ADP released its December employment estimate of 807K vs Bloomberg consensus of 400K.
