Industrial production numbers are out today. Here are five key indicators referenced by the NBER’s Business Cycle Dating Committee.
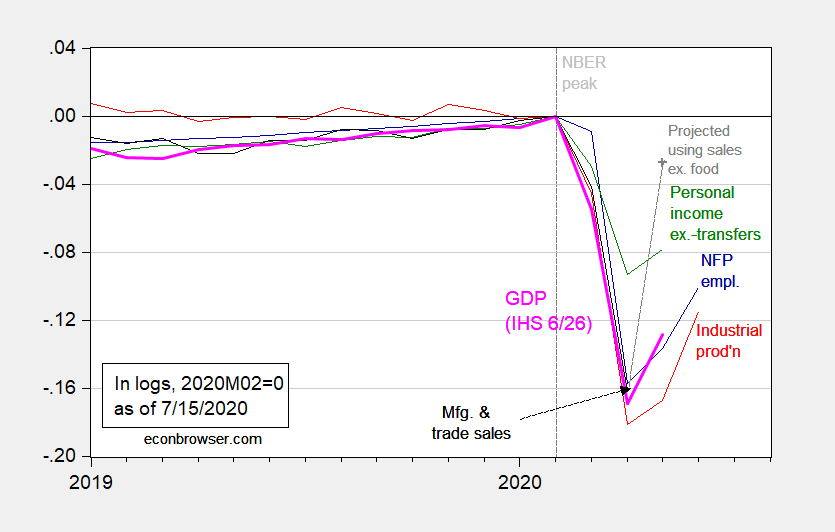
Figure 1: Nonfarm payroll employment (blue), industrial production (red), personal income excluding transfers in Ch.2012$ (green), manufacturing and trade sales in Ch.2012$ (black), and monthly GDP in Ch.2012$ (pink), all log normalized to 2019M02=0. May observation for manufacturing and trade sales projected using log-linear regression of sales on retail sales ex.-food services over the 2019-20M04 period. Source: BLS, Federal Reserve, BEA, via FRED, Macroeconomic Advisers (6/26 release), NBER, and author’s calculations.
If one were convinced that these indicators (along with many others) were going to continue to trend upwards, one could imagine a recession declared as starting in 2020M02 (NBER peak) and ending in 2020M04 (trough). However, if there were to be a relapse in some of the indicators in July-August (see discussion here), one could imagine a longer contraction eventually being declared (some accounts say there’s an increasing view in the Fed along these lines).